

Table of contents
A great business can emerge almost anywhere in the U.S., but some states make it easier than others. As it turns out, Midwestern red states offer the best prospects heading into 2026.
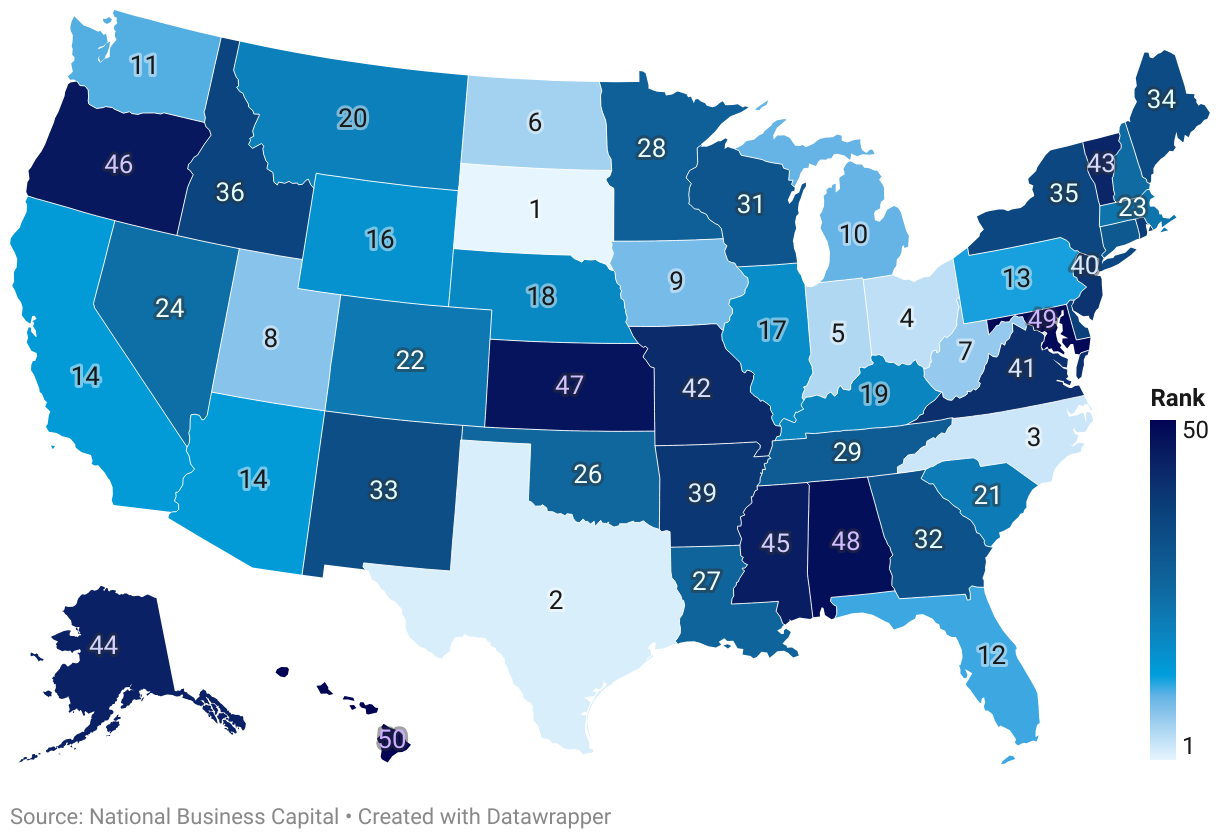
NationalBusinessCapital.com’s second annual report, “The Best States to Start A Business,” found that South Dakota (1st) offers the best overall climate for new businesses this year. Also making a strong showing were other northern central states like Ohio (4th), Indiana (5th), and North Dakota (6th), Iowa (9th), and Michigan (10th). These states have been effectively balancing growth, favorable business survivability rates, modest tax burdens, and a productive labor pool.
While other regions didn’t perform as well in aggregate, they do offer their own specific advantages. The South put up a strong showing with low taxes and energy costs led by Texas (2nd), North Carolina (3rd), and West Virginia (7th). Performance was a bit more mixed in the region, however, with Virginia (41st), Mississippi (45th), and Alabama (48th) showing low, or even negative, GDP growth in Q2 of 2025.
While it wasn’t a banner year for blue states, which lagged slightly behind in recent GDP growth, businesses able to leverage their substantial capital assets and stronger labor productivity growth may find states like Washington (11th) or California (14th) to be favorable. Last year’s leader, Colorado (22nd), fell down the chart thanks to low labor productivity growth, high energy costs, and fewer business applications relative to other states.
Key Findings
- Greater Proportion of New Businesses Surviving While Established Businesses Experience Strain. The average first-year survival rate in states rose to 76.8% in 2024 from 75.9% in 2023. However, average five-year survival rates fell slightly from 51.6% to 51.2%.
- Red States Sweep The Top 10; Have Slightly Better Longevity, Q2 GDP Growth. All 10 of the top states this year are red states (as determined by the results of the last election). Overall, red states had a stronger showing, with an average score of 53.9 out of 100 to blue states’ 45.9. Washington (11th) led blue states thanks to strong labor productivity growth and the highest first-year survival rates for businesses. Red and blue state businesses both had an average first-year survival rate of 76.8%, but red state businesses were slightly more likely to make it through their fifth year (51.6% to 50.5%). Red state GDPs grew faster in Q2 of 2025 at 3.6% versus blue states at 3%.
- Red States Offer Lower Tax Burden, Energy Costs. Blue States Offer Labor Productivity, Capital. Beyond longevity, red states were able to prevail by offering more favorable tax rates and significantly lower electricity costs. The average cost per kWh for commercial businesses in red states is 11.8 cents and 18.6 cents in blue states. Blue states saw higher productivity gains, however, rising 2.8% to red states’ 2%. Blue states also had more SBA approvals at 29.4 approvals per 100,000 to red states’ 21.9. Venture capital remains largely a blue state phenomenon.
- Midwest States Offer A Bit Of Everything, But Are Residents Taking Advantage Of It? The Midwest had the strongest overall showing regionally with a score of 55.6, with the region offering generally favorable GDP and labor productivity growth and a modest tax burden. Businesses in these states were generally durable, particularly at the five-year mark. While access to capital tends to lag behind the coasts, venture capital is active in many Midwestern states, and SBA loan approvals generally land somewhere near the median. At the same time, Midwestern states tended to rank low in business applications per capita, suggesting untapped potential for bold entrepreneurs.
- Pacific Region Businesses Start Strong, Struggle Over Time. The Pacific region, bolstered by California, had the largest gap between first- and fifth-year survival rates. A typical business in the region has 78.9% chance of making it through its first year, higher than any other region. However, the chance of making it through their fifth year was just 50.6%, lower than every region but the Mountain West. The Pacific region had the lowest average overall score of 44.8.
Methodology
To create our rankings, we selected eleven metrics that represent the advantages and burdens of starting a business in each state. For each metric, the lowest scoring state was given a rank of 50, while the highest ranking was given a rank of 1. Each metric was multiplied by a select weight and aggregated together to create an overall score for each state. To account for increasing energy costs, as well as AI-driven productivity considerations, we have added infrastructural considerations like labor productivity growth and electricity costs. We’ve also condensed taxes to a single metric.
Here are the eleven metrics we chose, along with the percentage used to calculate the weight of each metric:
Year One Survival Rates (10%): This metric is the percentage of businesses that have made it to one full year of operation for the 12-month term ending in March 2024. It represents how difficult it is to get a business off the ground in the state. Data was sourced from the Bureau of Labor Statistics’s Business Employment Dynamics report.
Year Five Survival Rates (14%): This metric is the percentage of businesses that have successfully made it to their fifth year of operation for the 60-month term ending in March 2023. It represents how difficult it is to sustain a mature business within the state. Data was sourced from the BLS’s Business Employment Dynamics report.
GDP Change (8%): This metric represents the change in the state’s real GPD from Q1 of 2025 to Q2. It serves as a gauge of the state’s current economic conditions. Data was sourced from the Bureau of Economic Analysis.
LLC Filing Costs (3%): This metric is the cost of establishing a limited liability corporation–often an advantageous form of incorporation for small businesses–within the state. Data was sourced from LLC University.
LLC Annual Costs (5%): This metric is the annual filing (or other) fee cost for maintaining limited liability corporation status within the state. Data was sourced from LLC University.
Business Tax Burden (16%): This metric is sum of normalized and weighted business tax burdens for the state, taking into account three factors: top personal income tax rate, top corporate tax rate, and gross receipts tax. The closer a state’s score is to 1, the higher its relative tax burden. Data was sourced from the Tax Foundation.
Business Applications Per 100,000 (8%): This metric represents the number of business applications filed within the state in 2024 divided by the state’s population. It serves as an indicator of entrepreneurial activity within the state. Data was sourced from the US Census.
Venture Capital Per Capita (8%): This metric represents venture capital invested in companies within the state in 2024, divided by the state’s population. It serves as an indicator of how active private equity funding is within the state relative to the state’s size. Data was sourced from NVCA.
SBA Loan Approvals Per 100,000 Residents (10%): This metric is the number of SBA 7(a) and 504 loan approvals in each state for 2025 as of September 2025 for every 100,000 residents in the state. As SBA loans are a key source of small business funding, this metric serves as an indicator of the financial resources available to small businesses. Data was sourced from the Small Business Administration.
Labor Productivity Change (9%): This metric measures productivity growth within the state in 2024. Higher labor productivity generally translates to better efficiency for businesses with employees. Data was sourced from the Bureau of Economic Analysis.
Commercial Electricity (9%): This metric is the average cost of commercial electricity in the state in cents per kHw using the most recent data from the Energy Information Administration.
The Top 10 States to Open A Business In 2026
1. South Dakota

Score (out of 100): 72.7
Rank: 1st (+15 from last report)
South Dakota makes a giant leap to first place heading into 2026. So what makes the Mount Rushmore State the most favorable for starting a new business? For the tax-conscious, it doesn’t get much better, with South Dakota not levying a personal income, corporate, or gross receipts tax (1st, tied), a trait it shares only with Wyoming. The state has a substantial number of self-starters (9.317 business applications per 100,000 residents, 7th), with most having a relatively easy time getting off the ground (78.5% 1st year survival, 7th). The majority are still around five years later (55%, 5th tied). Additionally, South Dakota saw some of the highest real GDP growth in the nation from Q1 to Q2 (5.2%, 6th).
Despite these advantages, South Dakota may not be the best fit for everyone. Startups seeking venture capital, for example, will find it very difficult to find ($5.80 invested per capita, 47th).
2. Texas

Score: 70.2
Rank: 2nd (+2)
The Lone Star State rises to second with strong GDP growth (6.8%, 2nd) and cheap energy (9 cents per kWh, 3rd). Most new businesses will enjoy Texas’s lack of personal or corporate income taxes (4th, tax burden), though higher-earning companies do have to contend with the state’s franchise tax. Initial LLC filing costs are high (47th), but there’s no annual filing fee after that (1st). Overall, businesses tend to fare pretty well, with 77.8% making it through their first year (15th); 53% are still around five years later (16th).
Nevertheless, Texas has been lagging in business applications, with just 288 filed per 100,000 residents (41st).
3. North Carolina

Score: 69.7
Rank: 3rd (+15)
North Carolina substantially improves its ranking, offering margin-sensitive businesses low electricity costs (10 cents per kWh, 9th) and increasing labor productivity (3.7%, 7th). It’s also one of the easier states in which to get a business off the ground (79.5% survive their first year, 4th), with most still around five years later (54.4%, 9th). Tax burdens are also relatively favorable (12th), with low personal and corporate taxes.
North Carolina companies facing cash flow shortfalls may have to get creative, however, as the state ranks 35th in SBA loan approvals per capita for the first three quarters of 2025.
4. Ohio

Score: 69.3
Rank: 4th (+6)
Ohio increases its Top 10 standing for 2026, stepping up from 10th place to fourth. Ohio entrepreneurs face some friction in their first year (76.5% survive, 24th), but those that weather the initial storm fare as well as those in South Dakota at the five-year mark (55% survive, 5th tied). Ohio offers some additional advantages in the form of cheap LLC costs (no annual fee, 1st) and better access to venture capital ($1,580 invested per capita, 7th). New businesses in Ohio face a relatively low tax burden (6th), with the state phasing out its gross receipts tax for most small and mid-sized businesses.
However, despite the fertile soil, entrepreneurship is rare in Ohio as of late, with just 71 business applications filed per 100,000 residents (50th).
5. Indiana

Score: 62.2
Rank: 5th (+3)
Indiana creeps up a few rankings on the back of greatly improved labor productivity (6.3%, 1st), which makes it a good place to hire. Beyond that, Indiana offers strong, if not superlative, showings in many metrics. 78% of new businesses survive their first year, and 53.4% their fifth (14th for both). Tax burdens are fairly low (13th), particularly if you’re not paying corporate taxes, and keeping an LLC in good standing isn’t too burdensome (13th annual costs). More Hoosiers are filing business applications too (2,472 per 100,000, 19th).
Energy-intensive businesses may bristle at Indiana’s commercial energy costs, however, which average a little over 14 cents per kWh (36th).
6. North Dakota

Score: 61.5
Rank: 6th (+11)
North Dakota roars into the Top 10 with the strongest Q2 GDP growth of any state (7.3%), as well as the highest number of business applications per 100,000 residents (20,499). Those businesses also enjoy the cheapest commercial electricity rates in the nation (7.5 cents per kWh), and a low tax burden (9th).
All of this growth hasn’t come from efficiency, however, with North Dakota labor productivity growth at a tepid 0.9% (43rd). Venture capital is also scarce on the plains (49th).
7. West Virginia

Score: 61.1
Rank: 7th (+41)
West Virginia is this year’s “hear me out” state, jumping up from last year’s bottom 10 to number 7. Poor access to capital remains a critical issue in West Virginia, which frequently lacks any venture capital ($0 per capita, 50th) and has the second-worst SBA loan approval rate in the nation (12.1 per 100,000). This barrier may be insurmountable for many types of businesses and larger enterprises. However, from there, things start to look a lot brighter for the small and scrappy.
Despite its cash flow handicap, West Virginia businesses boast the highest five-year survival rate in the U.S. (57.6%, 1st). This isn’t just a survival of the fittest scenario either; first-year survival rates are also strong (79.1%, 5th), and there are quite a few people starting businesses too (6,192 applications per 100,000, 10th). Additionally, both GPD (4.1%, 13th) and labor productivity (12th) have been on the upswing.
8. Utah

Score: 60.6
Rank: 8th (-6)
Utah continues to uphold its reputation as a business-friendly state, even as it loses some ground going into 2026. Entrepreneurship is thriving in the Beehive State, with 13,947 business applications per 100,000 Utahns (3rd). The state’s strong financial infrastructure makes it easy to access funding at low interest rates (45.6 SBA loan approvals per 100,000 residents, 2nd), and commercial electricity costs are competitive (10.8 cents per kWh, 11th).
Utah’s impressive growth engine did sputter a bit in Q2 (3.2% GDP growth, 31st), however, at least relative to other states, and surviving the Wasatch Front is challenging. Making it through your fifth year is a flip of a coin (50%, 32nd)
9. Iowa

Score: 60.0
Rank: 9th (+24)
Iowa is the second most improved of this year’s Top 10. The Hawkeye State currently has some of the best survival stats for first-year businesses (80.2%, 3rd), a good sign given Iowa’s recent flurry of business applications (2,781 per 100,000, 16th). While it remains to be seen how this batch will do at the five-year mark, the five-year survival rate stands at a respectable 53.3% (15th). Improved labor productivity (3.6%, 9th) will likely help margins, and low annual LLC costs (13th) make it easy to limit liability.
As impressive as Iowa’s move up the ranking is this year, the state will likely need to improve its access to capital to make further gains, as it ranks low in both SBA loan approvals (42nd) and venture capital investments (37th) per capita.
10. Michigan

Score: 58.5
Rank: 10th (-8)
Michigan topped our list of best states in which to purchase an established business, and many of those advantages translate to starting fresh in the Great Lakes State, including the longevity of businesses that take root (53.9% five-year survival rate, 11th). Michigan has made substantial labor productivity gains recently (3.6%, 9th), and offers above-average access to capital (22nd venture capital, 23rd in SBA loan approvals). And while it isn’t setting any records, Michigan’s GDP growth in Q2 was ahead of most other states (3.6%, 20th).
However, like neighboring Ohio, Michigan is lagging in business applications (743 per 100,000, 37th). Commercial electricity costs have also been higher than those in most other states (38th).
The Bottom 10 States to Open A Business In 2026
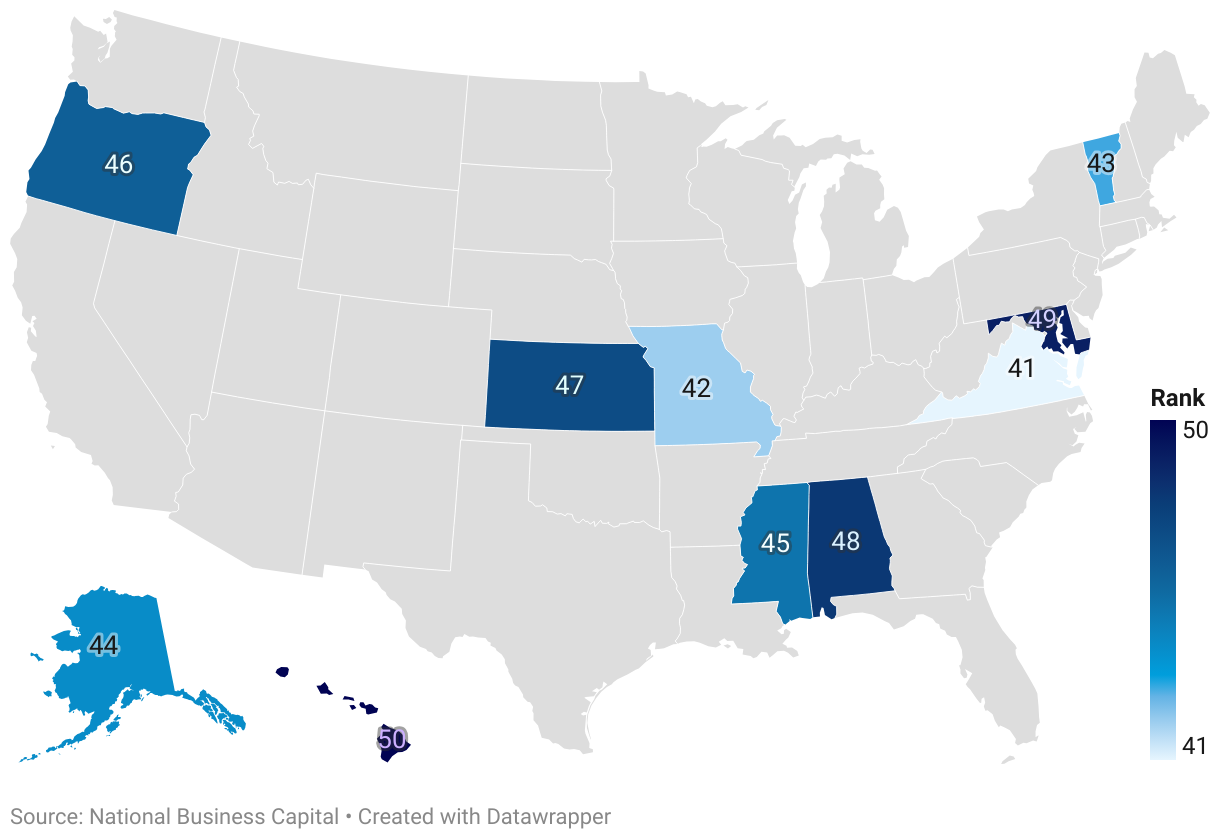
- Virginia (41.8 out of 100; -29): Virginia falls far to the bottom 10 due to a drought in entrepreneurial activity (83 business applications per capita, 49th) and sluggish recent GDP growth (1.7%, 44th). Companies seeking venture capital (3rd per capita) and competitive electricity prices (9.7 cents per kWh, 5th) may still want to give it a go.
- Missouri (Score 41.6; -2): After narrowly missing the bottom 10 last year, Missouri falls two ranks thanks to its brutal business attrition rate. Just 72.9% make it through their first year (49th), and a mere 43.2% (49th) are still around at the five-year mark.
- Vermont (40.8; +4): Vermont’s labor productivity growth lags behind most of the nation (0.5%, 46th), and its electricity costs (19.2 kWh, 41st) may be an impediment for energy-intensive operations. Business formation (6th in applications) and SBA funding (5th) are strong, however.
- Alaska (40.4; -14): Business survival is almost Darwinian on the Last Frontier. Only 73.7% (48th) making it through the first year, but those who tough it out have a good chance of making it through their fifth (56%, 3rd). Funding is scarce, and costs are high.
- Mississippi (38.9; -21): A Q2 GDP drop (-0.9%, 49th) suggests challenging times in Mississippi, and limited access to affordable capital remains a major issue (12.1 SBA approvals per 100,000, 50th). Costs are generally low, however.
- Oregon (37.9; +0): Oregon carries a high business tax burden (47th), whether you pay personal, corporate, or gross receipts tax, and the state has been lagging in GDP (34th) and labor productivity growth (39th). SBA loan approvals (11th) are well-above average, however.
- Kansas (35.7; +3): Kansas moves up from last place thanks to strong Q2 GDP growth (6.7%, 3rd), but it remains a challenging environment for businesses, with just 46.8% surviving five years (48th).
- Alabama (34.6; -12): Alabama’s had a sluggish year (1.2% GDP growth, 46th; 0% labor productivity growth 49th) with limited access to capital (42nd, venture capital; 48th SBA loan approvals). Businesses remain fairly resilient, however, with 52.9% (18th) still around after five years.
- Maryland (31.2; -11): Like its neighboring state, Virginia, Maryland has been in GDP growth (1.4%, 45th) and business application (44th) slump. Unlike Virginia, it’s also seen minimal labor productivity growth (0.2%, 47th). While businesses get off to a decent start in the Old Line State (76.9% survive first year, 21st), most fail to make it to five years (48.7%, 40th).
- Hawaii (31.1; -27): High first-year attrition (46th) and minimal GDP growth (0.4%, 48th) make for a challenging business environment in the Aloha State, as do the highest commercial electricity prices in the nation (38.9 cents per kWh, 50th). Nevertheless, Hawaii’s entrepreneurial spirit is the second strongest in the nation (16,783 business applications per 100,000).
Complete Rankings of All 50 States