

Table of contents
If you work remotely or if you’re approaching retirement, you might want to consider being on vacation full-time. It’s not as expensive as you might think.
NationalBusinessCapital.com has completed its inaugural report, 10 Places To Buy A Home In 2024 Are More Affordable Than You Might Think, on home affordability and found that . . . well, there isn’t much out there. A review of metropolitan areas with populations over 300,000 found only a few areas that weren’t experiencing factors that make home ownership hard to afford. That’s the bad news.
The good news is, if you know all this, but you’re still in the market, there are some places that are surprisingly affordable. They’re not cheap, mind you, but they don’t make the top ten list of the most expensive places. And, the metropolitan statistical areas (MSAs) include some very attractive cities.
Do you want to feel like you’re on vacation all the time? You could live in the Honolulu, Washington, DC, or Las Vegas MSAs. Are you more of a sun worshipper? Not a single Florida MSA made the list of most expensive locations. And, perhaps most surprising of all, some MSAs with notoriously pricey reputations avoided the list, like Connecticut’s Gold Coast (which includes Greenwich, Darien, and New Canaan) or Austin, Texas.
While there were many surprises, there were enough unsurprising trends on the list. Eight out of the ten most expensive areas to buy a home were on the California coast. The other two expensive MSAs, Boston and New York City, fit right in. At the other end of the spectrum, the most affordable home tended to be in the Rust Belt, with its relatively low cost of living. Combined with the lack of speculative investment in housing, the Rust Belt helped tame the fires of asset inflation seen in much of the US. Meanwhile, not surprisingly, the most expensive places were mostly found in California, where housing prices vastly exceed local incomes. New York City and Boston metro areas also landed among the least affordable, primarily due to the high cost of living and property taxes.
Surprising Findings
- Many Vacation Spots And Pandemic Boomtowns In The Sun Belt Aren’t As Cheap As They Used To Be But Are Still Affordable … Relatively Speaking: Many of the sunny cities that benefited from the remote work boom of 2019-2022–places like Miami and Austin–saw housing prices and cost of living shoot up during those years. Likewise, vacation hotspots like Las Vegas and Sarasota aren’t quite as overheated as one might expect. Housing prices are even declining in some of these markets due to high rates of homebuilding and cooling in migration.
- Despite Recent Explosive Growth, No Florida Cities Landed Among The 10 Most Expensive: Costs may be up in the Sunshine State, but it’s still less expensive than many of the places new residents are moving from. Miami, ranked 144th out of 167, was the most expensive Florida metro, with over 300,000 residents. Ocala, ranked 62nd, was the cheapest.
- Wealthy Suburbs And Small Elite Cities Are Often Cheaper Than Their Big City Neighbors: Back in the big blue states, wealthy enclaves like Southwest CT’s “Gold Coast” and Salinas, CA (which include Monterey and Carmel) haven’t gotten cheaper, but they may actually be a better deal than New York City, Boston, Los Angeles, or San Francisco these days, with home values more in line with local salaries.
10 Places That Are (Relatively) Less Expensive Than You Might Think
1. Miami-Fort Lauderdale-Pompano Beach, FL
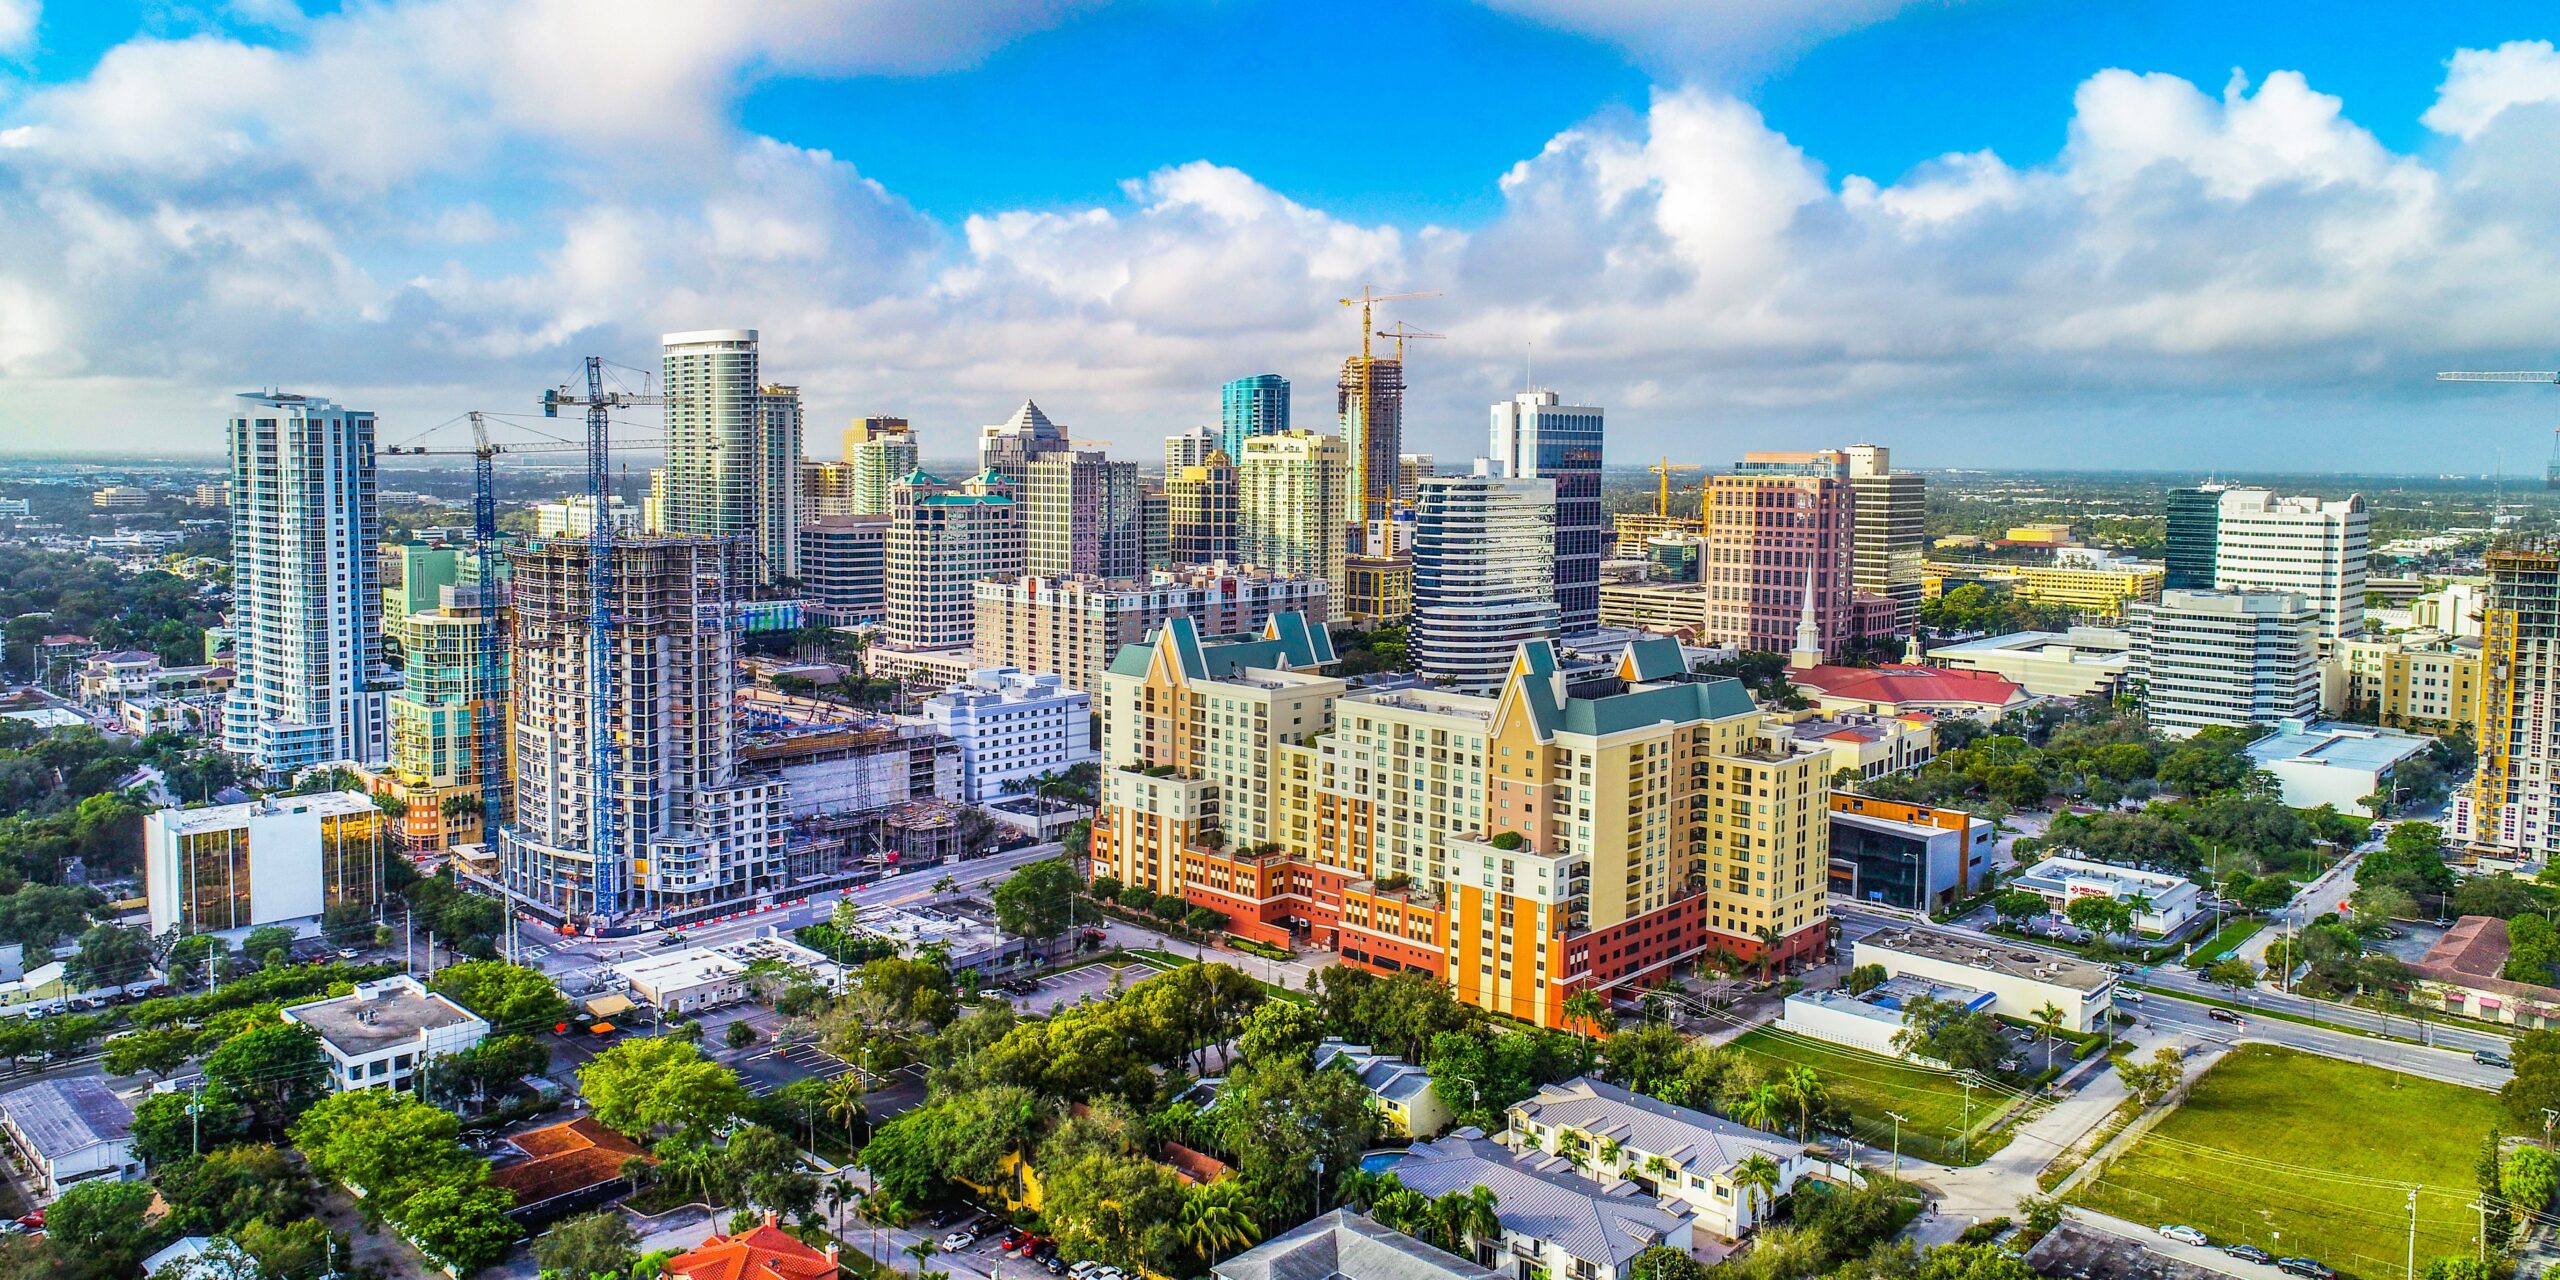
Score (out of 100): 22.8 (144th)
Florida cities have seen considerable growth over the past few years, but believe it or not, the Miami-Fort Lauderdale-Pompano Beach region–which includes uber-wealthy enclaves like the ultra-luxe Mar-a-Lago resort, the wealthy shopping venues down Worth Avenue in Palm Beach, and the winter equestrian capital of Wellington–is not one of them. In fact, Miami-Dade County actually lost about 80,000 people between 2020 and 2022, with cost of living frequently cited as a reason, but higher-income individuals may find South Florida to be relatively affordable.
While Miami is quite expensive with a 111.5 RPP (154th) and a very poor housing cost-to-income ratio (6.07) for local residents, housing prices aren’t quite as bad as they could be, with the median cost coming in at $429,800 (132nd). Additionally, real personal income has held up better against inflation (-2.9%, 50th) here than in many other metros.
2. Salinas, CA
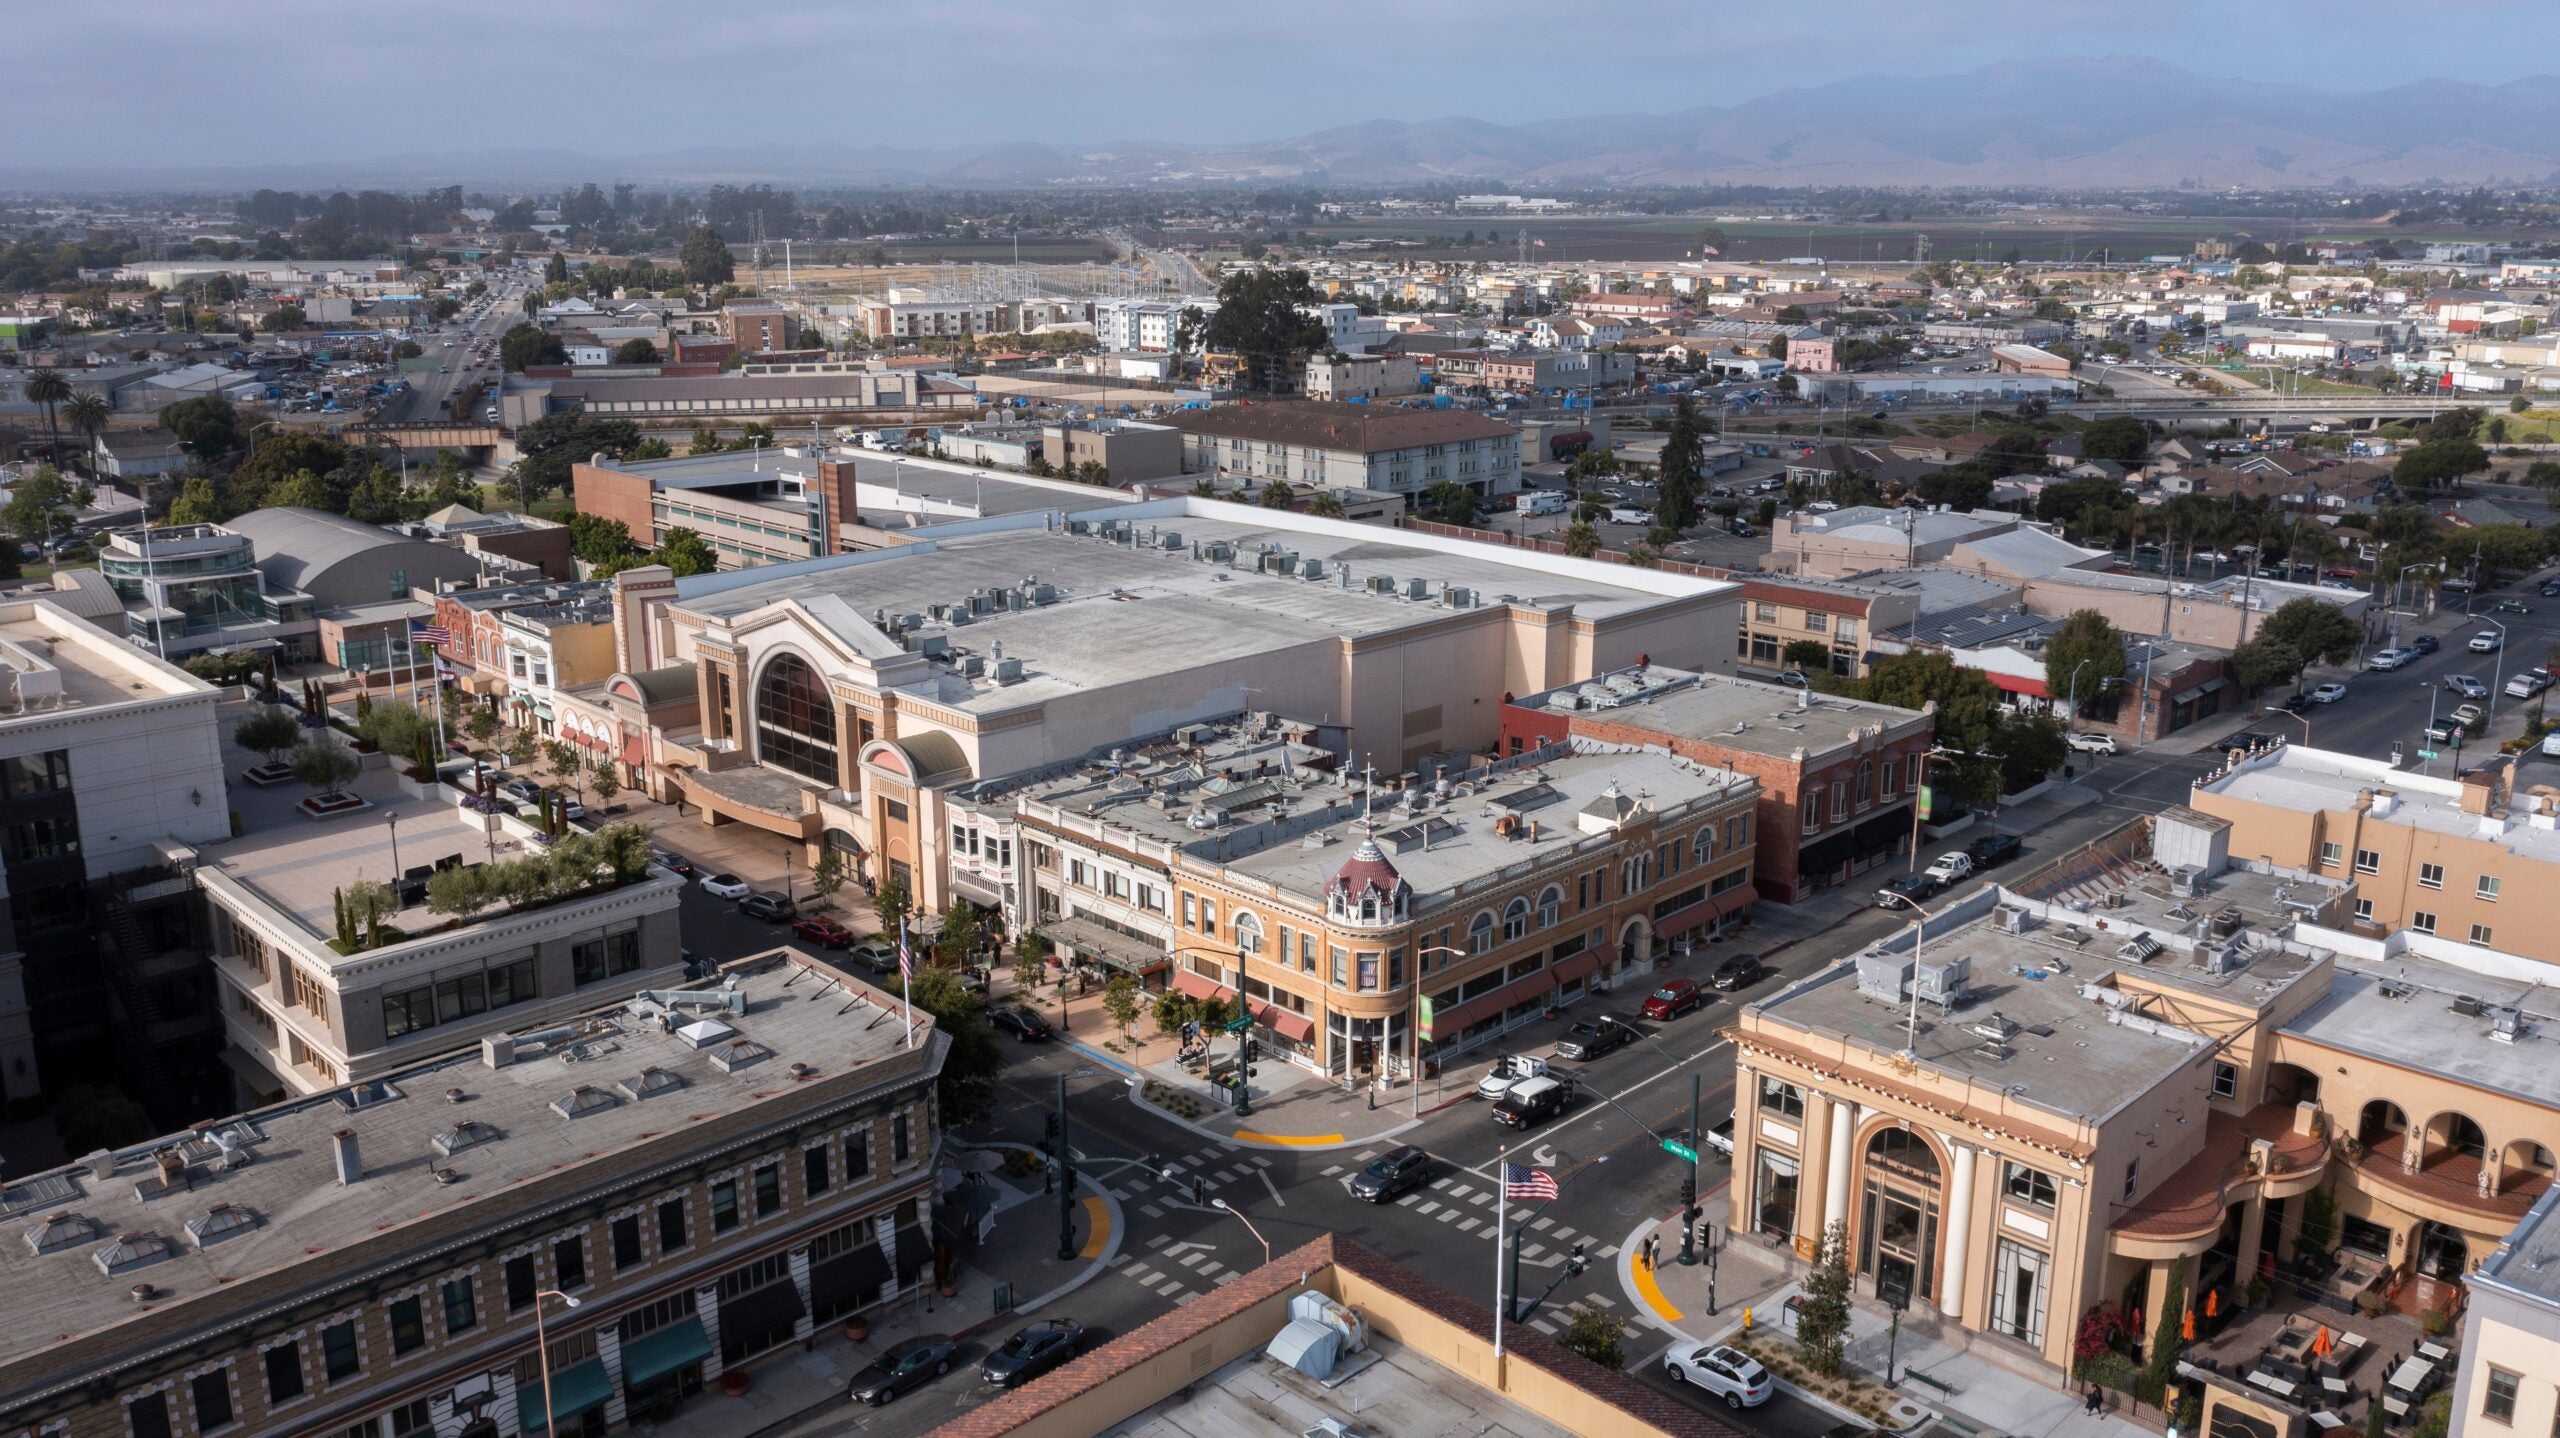
Score (out of 100): 11.2 (157th)
California dominates the 10 least affordable places on our list, so one might expect this wealthy enclave near Monterey Bay and Carmel to be one of them.
We’re being a little cheeky since Salinas actually does rank as the 11th most expensive metro on our list. But how did it beat the likes of San Jose, San Francisco, Ventura, and Los Angeles? For one, Salinas actually builds housing (334 permits per 100,000, 69th), which takes a little pressure off local home prices ($732,500, 158th) which, while astronomically priced relative to local salaries (7.89 times, 160th), aren’t as wildly out-of-synch as some of the bigger Golden State cities.
3. Austin-Round Rock-Georgetown, TX

Score (out of 100): 30.4 (135th)
The Austin metro area’s population increased by 6% from 2020 to 2022, making it one of the fastest growing in the nation. Despite some well-publicized growing pains, Austin is still affordable, at least relative to many other popular metros.
Yes, homes aren’t cheap ($490,000, 141st), and property taxes are brutal ($7,142, 161st), but the cost of living remains slightly below the national average (98.8 RPP, 111th), and incomes are staying ahead of inflation (2.1%, 2nd). Housing prices do appear to be falling, however, thanks to Austin’s high rate of home building (698 permits per 100,000, 25th) and slowing in-migration.
4. North Port-Sarasota-Brandon, FL

Score (out of 100): 37.4 (118th)
Despite increasing popularity and in-migration, the Florida Gulf Coast still isn’t that expensive … relatively speaking.
At a median of $402,600 (125th) home values are pricey, but may be more affordable for imported salaries than local ones (5.32 times the median local household income, 133rd). The cost of living isn’t too much higher than the national average (101.4 RPP, 123rd), and property taxes aren’t too bad ($2,951, 87th). High rates of building (1,170 permits per 100,000, 7th) should also help keep prices down in the near term.
5. Naples-Marco Island, FL

Score (out of 100): 30.6 (134th)
This traditionally expensive region in Southwest Florida may not be the cheapest locale in the Sunshine State, but as elite coastal properties go, you could do worse.
Homes around Naples cost a little over half a million on average (148th), considerably more expensive than what local salaries can support (6.7 times, 155th), but rampant construction (753 permits, 19th) and resilient real personal income (0.1, 11th) point to more affordability in the near future.
6. Washington-Arlington-Alexandria, DC-VA-MD-WV

Score (out of 100): 22.5 (145th)
Homebuyers looking for something near the Acela corridor may be surprised to find the Beltway area to be among their more affordable options.
At a median $553,100 price point (150th), homes in and around our nation’s capital aren’t cheap, but strong local salaries that have held up relatively well to inflation (-3.7%, 68th) keep them from being as wildly out of sync with local means as many other metros (4.71 ratio, 116th).
7. Seattle-Tacoma-Bellevue, WA
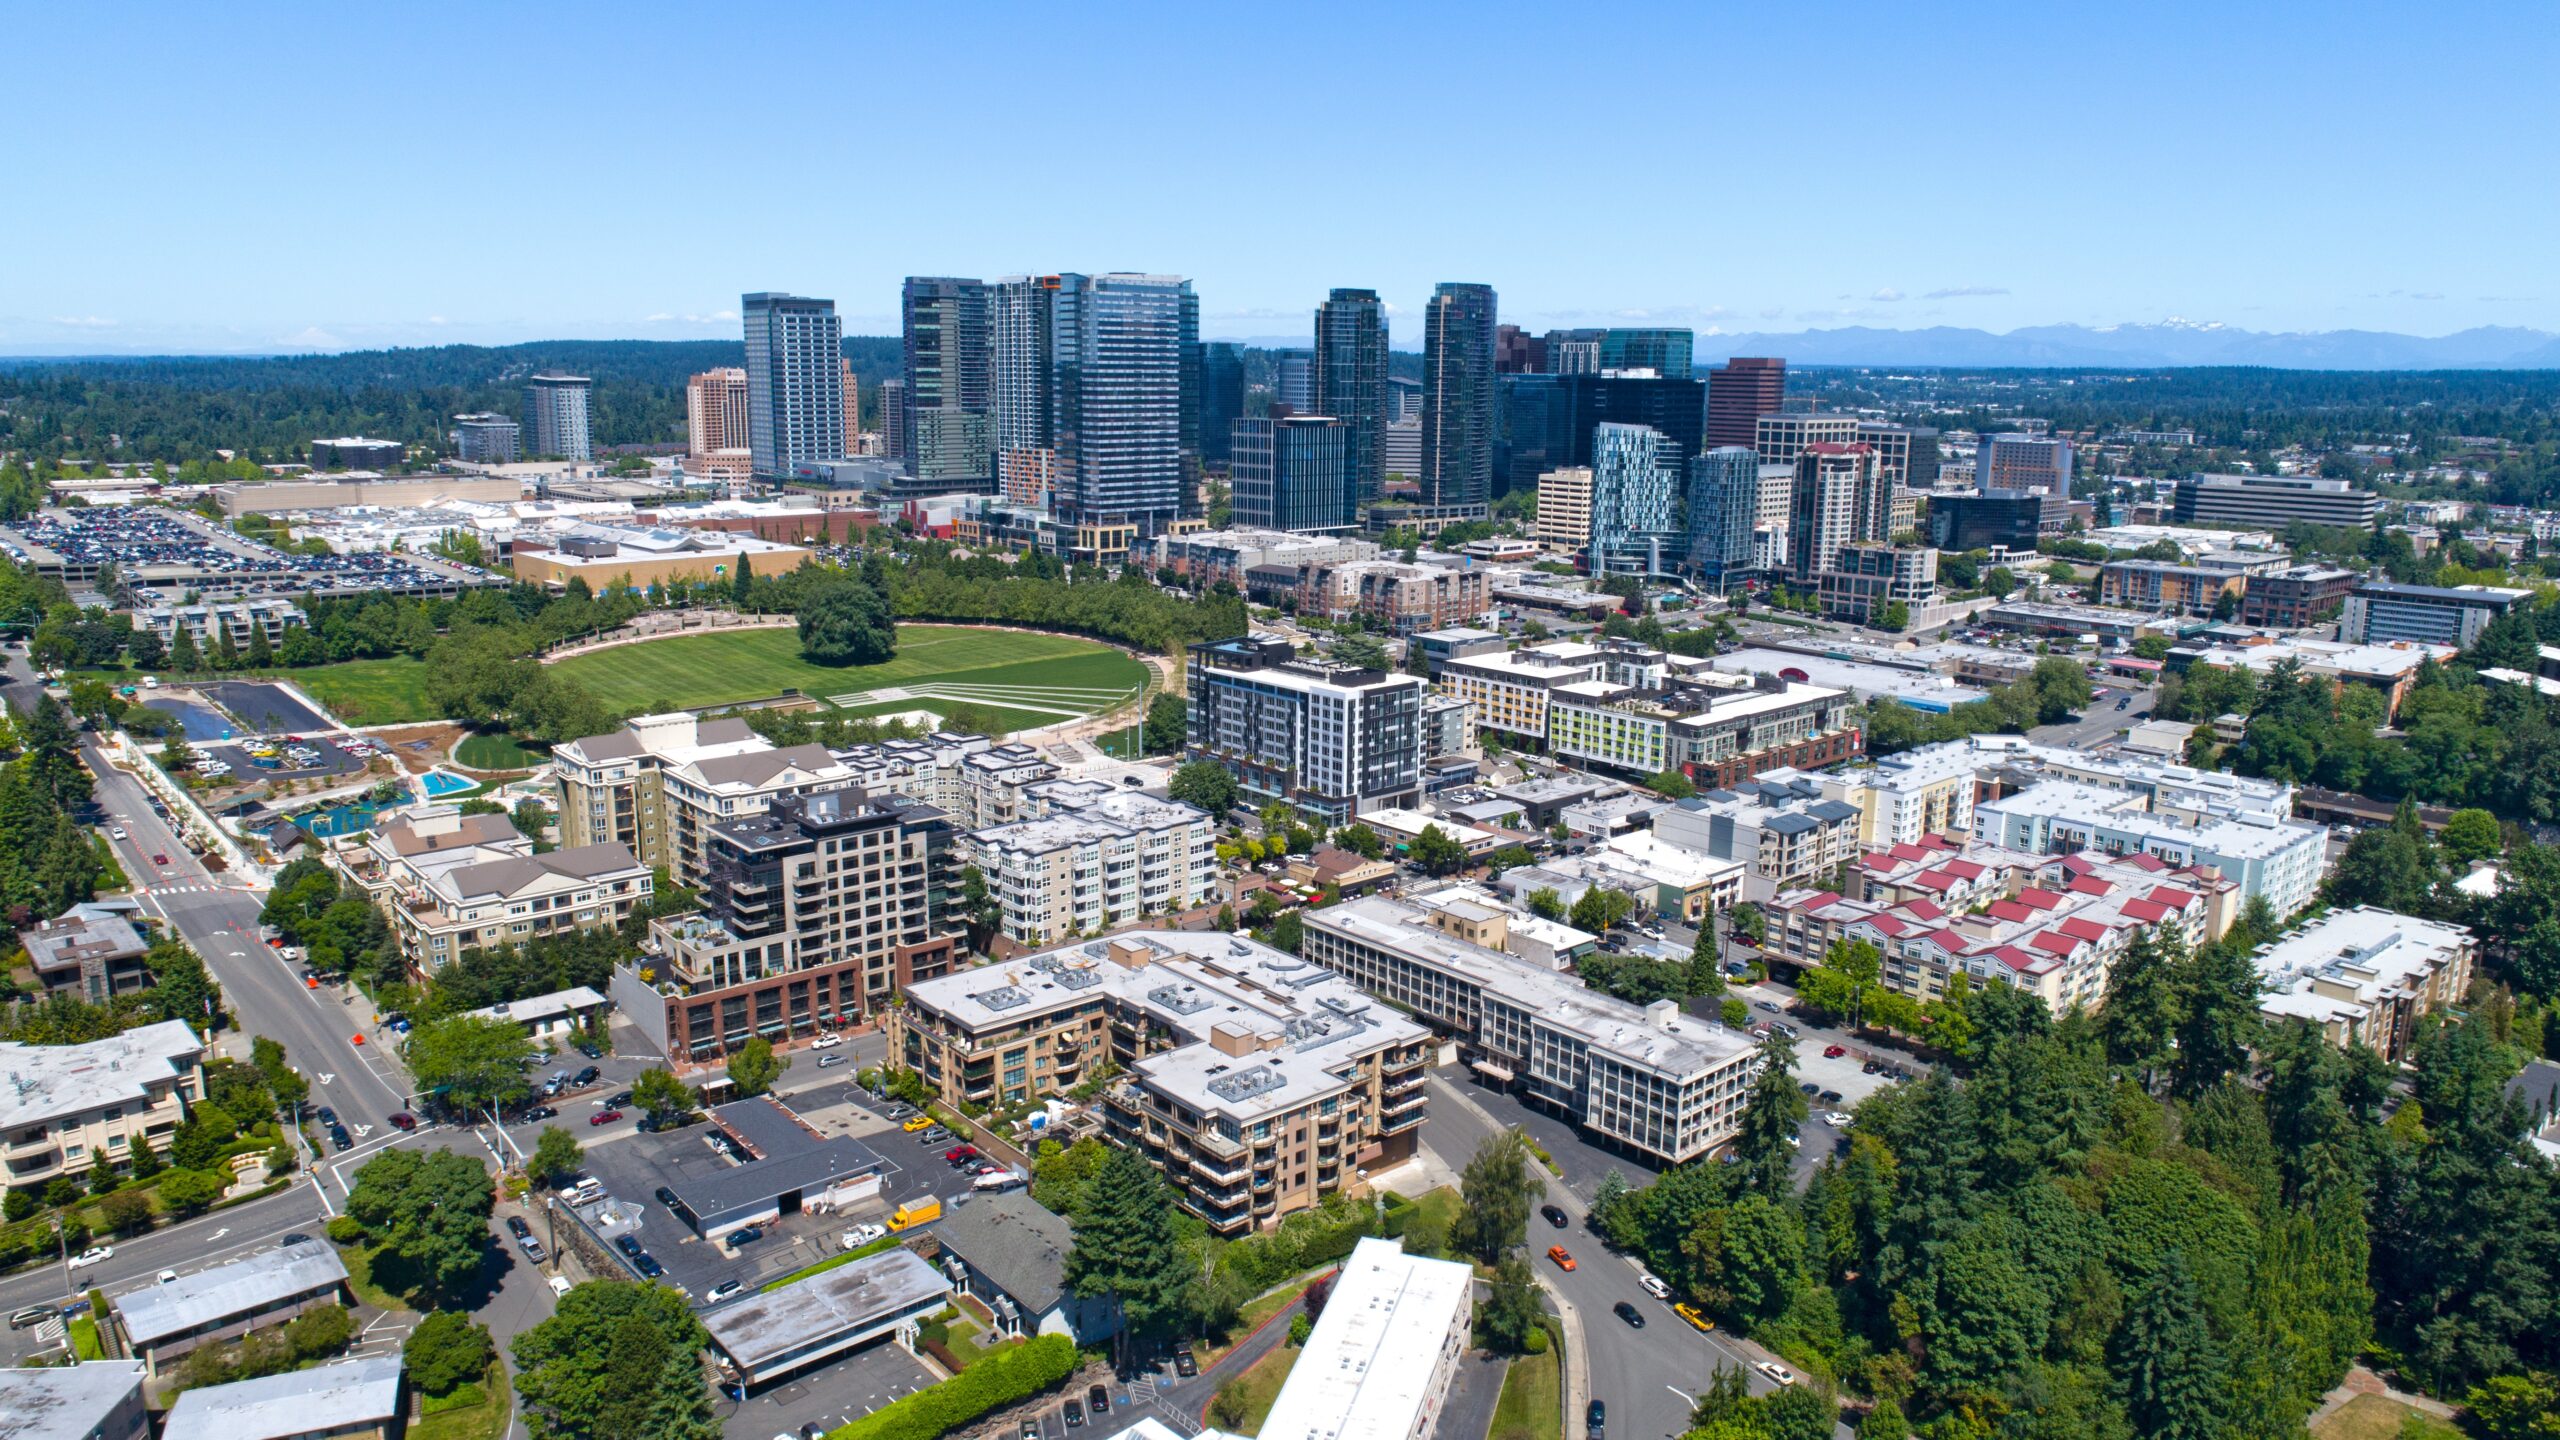
Score (out of 100): 19.0 (150th)
Seattle managed to narrowly avoid finishing among our 10 most expensive places, something a feat considering how stressed the West Coast housing market is.
Sure, the median house may cost over $700,000 (157th), with $5,704 in annual property taxes (150th) and over $2,500 in monthly expenses (156th), but at least the Puget Sound region is doing something about it. The Greater Seattle area saw 824 housing permits per 100,000 in 2022 (14th). Buying power, too, is holding up better than many other metros (-3.0%, 51st).
8. Urban Honolulu, HI

Score (out of 100): 15.4 (154th)
Hawaii is close to the platonic ideal of a tropical island paradise, so it may come as a surprise to hear that Honolulu didn’t land among our top 10 most expensive MSAs.
True, Honolulu homes are among the most costly in the nation at $874,500 (165th), which places them 9.05 times beyond the local median income (165th). So what saved it from the bottom 10? Those who can afford to nab some Honolulu real estate can enjoy very low property taxes relative to home values ($2,352 median, 61st).
9. Las Vegas-Henderson-Paradise, NV
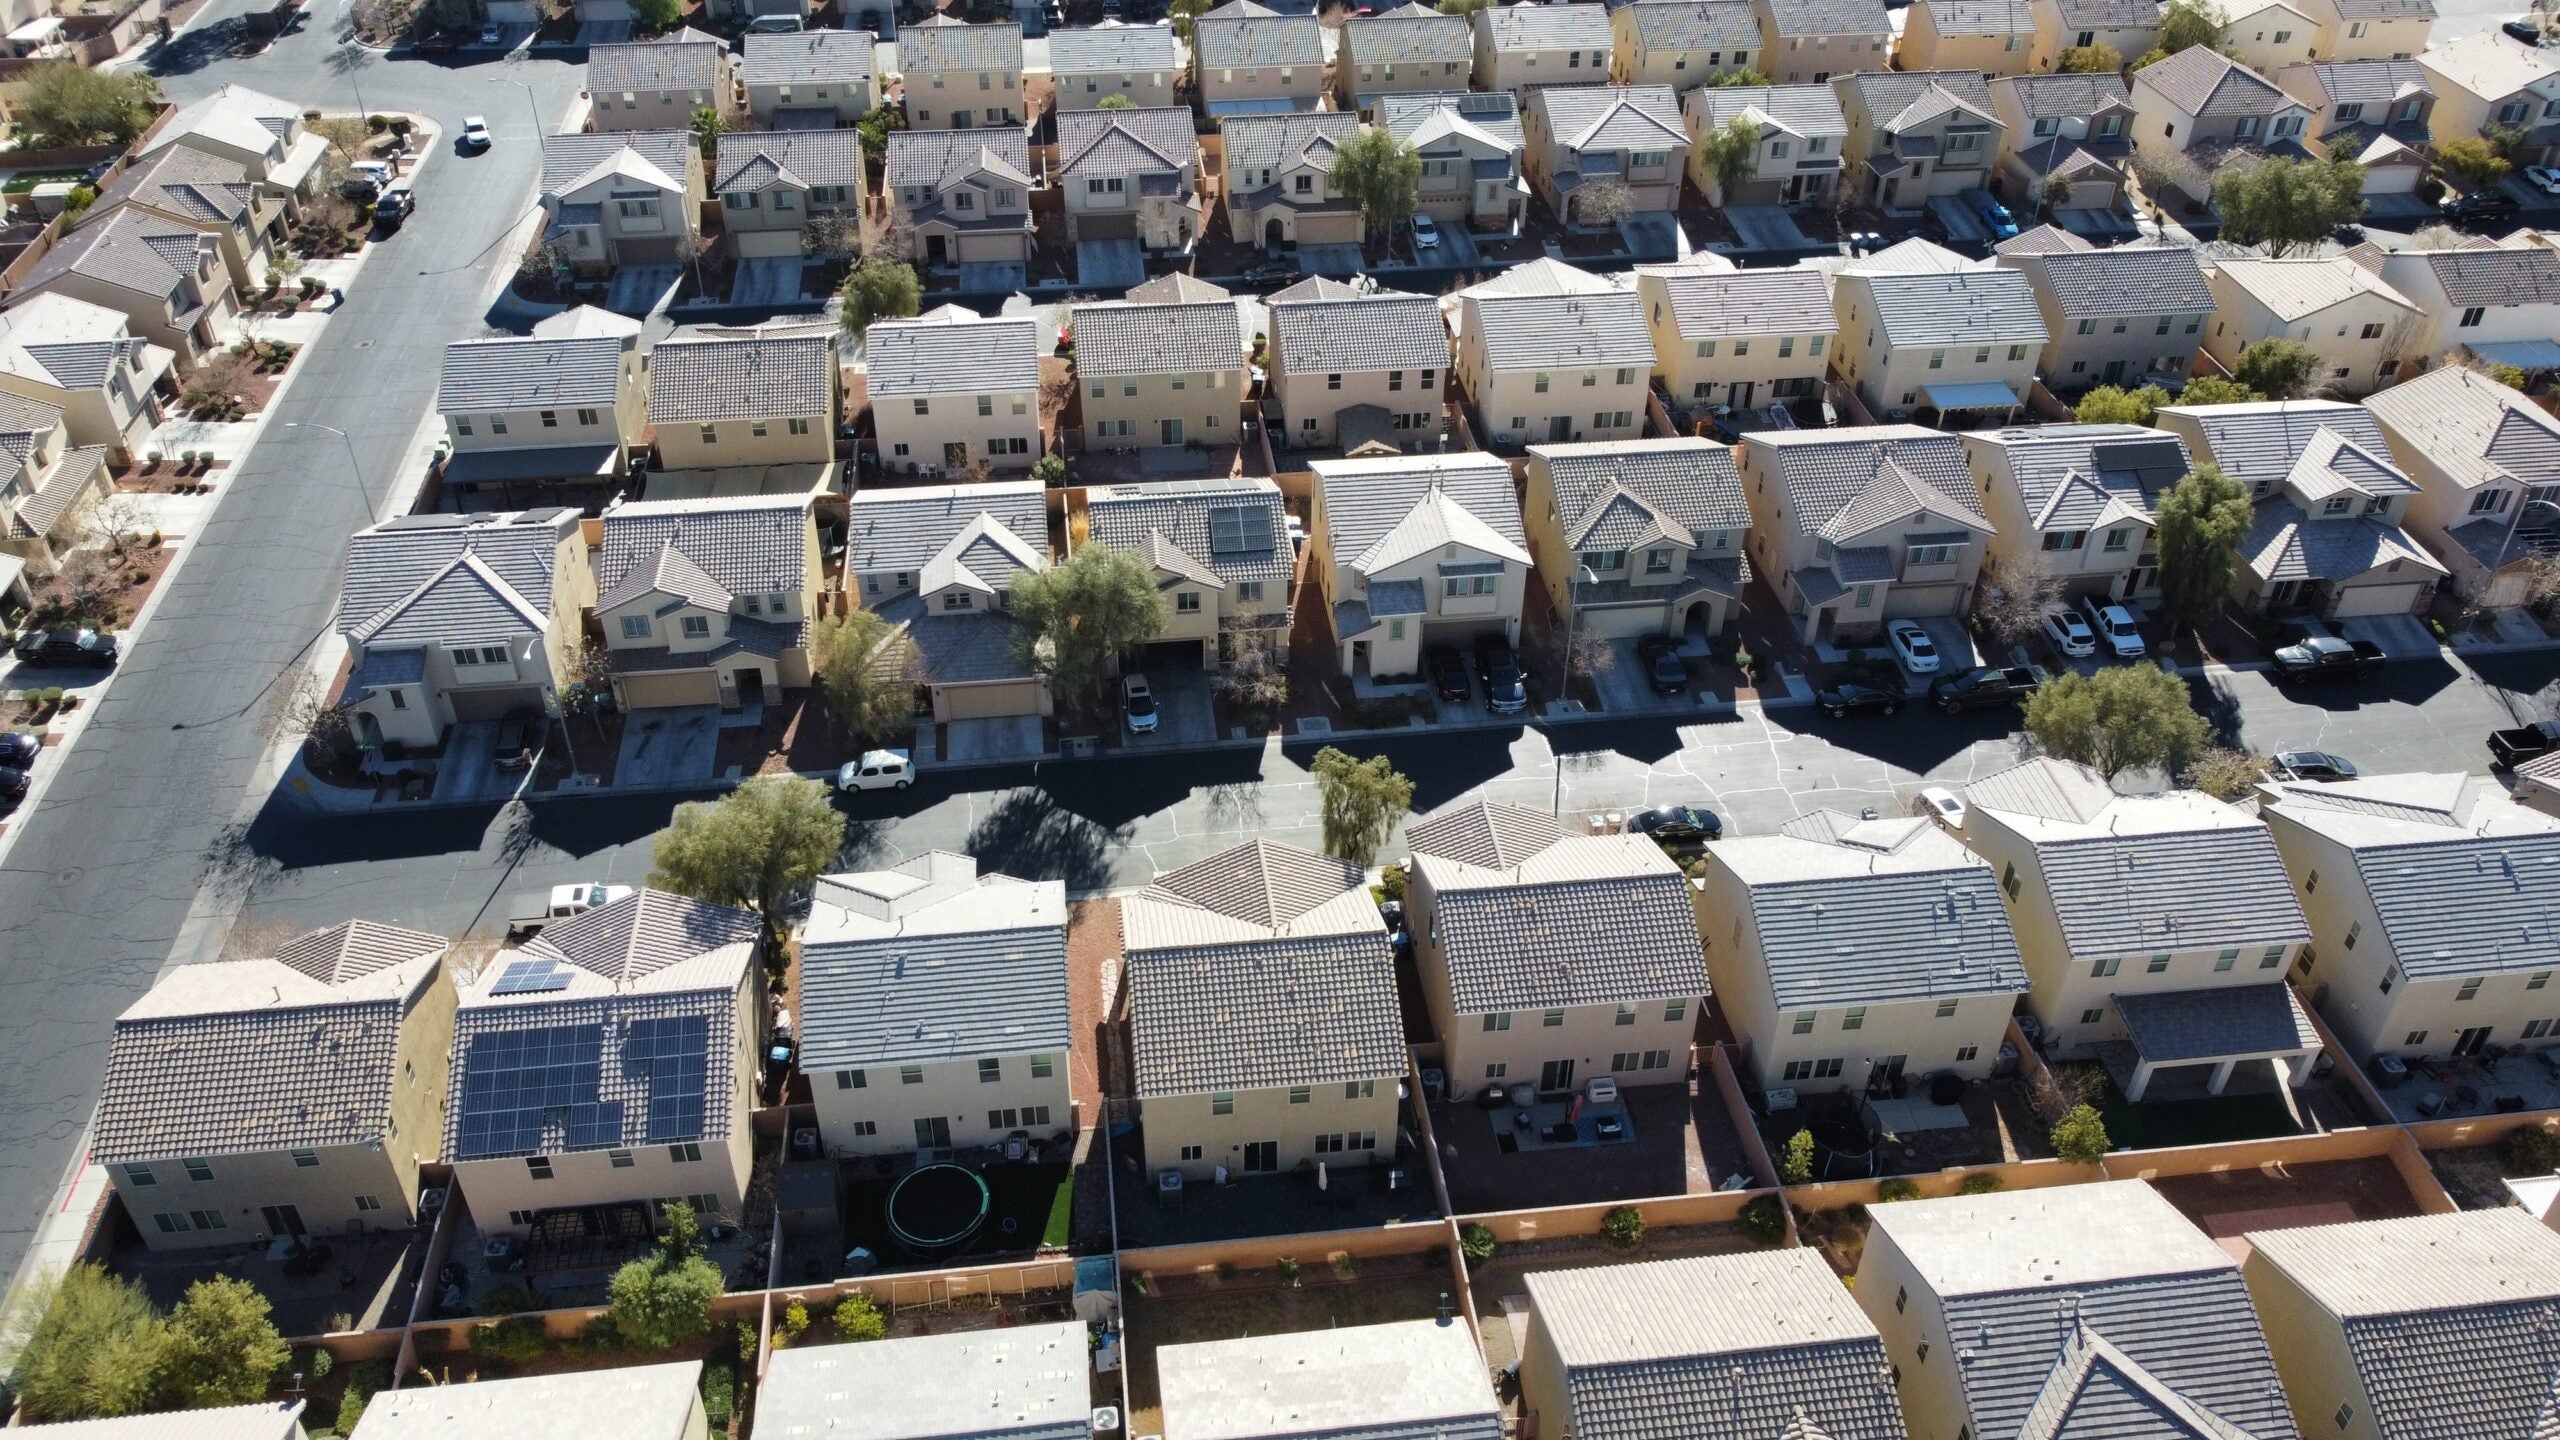
Score (out of 100): 36.4 (121st)
Homebuyers who want to live within reach of the Strip may be happy to hear that Las Vegas hasn’t overheated as much as some other markets. Just make sure you’re earning more than the local median income.
Homes in Las Vegas have gotten a bit pricey ($432,200, 133rd, 6.11 times the local median household income, 146th), but the region still has a low cost of living by national standards (96.5 RPP, 69th). You’ll also save money on property taxes, which tend to run a little under $2,000 per year (42nd).
10. Bridgeport-Stamford-Norwalk, CT

Score (out of 100): 13.7 (156th)
Living anywhere near the New York metro area comes at a premium, but Southwest Connecticut, which includes pricey suburbs like Greenwich, New Canaan, Darien, Westport, Southport, and Rowayton - narrowly avoided being among our 10 most expensive metro areas.
Homes here are far from cheap ($536,000, 146th), but they’re not as ludicrously priced relative to local income (5.06 ratio, 126th) as some of the other regions on this list. This is something of a feat, given how little construction is going on in the area (47 permits per 100,000, 163rd). Of course, you should still expect to pay a premium for goods and services (109.8 RPP, 150th).
The 10 Cheapest Places To Buy A House
1. Evansville, IN-KY
Score: 84.6 out of 100
When it comes to affordability in metropolitan areas with populations over 300,000, Evansville, IN, is about as good as it gets. Evansville’s proximity to Kentucky and Illinois on the Ohio River has made it an economic hub in Southwestern Indiana. The median home comes in at under $200,000 (21st), just slightly above the recommended 2.6 cost-to-income ratio (3.01, 20th), but you’ll save money on day-to-day costs (88.8 RPP, 9th).
2. Huntington-Ashland, WV-KY-OH
Overall Score: 84.1
Huntington, WV, and Ashland, KY, are two small cities that form the backbone of this tri-state area. Formerly a steel manufacturing hub, it’s since pivoted to biotech and services. The median home is just $155,200 (4th), around 2.7 times higher than the median household income (10th). Low property taxes ($1,209, 7th) and low median monthly expenditures (5th) plant the region comfortably in second place.
3. Little Rock-North Little Rock-Conway, AR
Overall Score: 83.5
Arkansas’s state capital is our third cheapest place to buy a home. Houses in Central Arkansas average a little over $200,000 (32nd), 3.3 times the typical household income (35th). Salaries have mostly held up here (-1.2%, 19th), with the metro’s job growth now exceeding pre-pandemic levels. A low cost of living (89.2 RPP, 13th) also helps make those salaries go pretty far.
4. Brownsville-Harlingen, TX
Overall Score: 82.6
While his border corridor near the Gulf Coast has been growing, it hasn’t seen the same level of explosive, wealth-generating growth as many other Texas metros. This translates to Brownsville being cheap, both in housing ($133,400, 2nd) and cost of living (85.4 RPP, 1st). Expect to pay fairly high property taxes ($2,848, 81st) relative to property value, as is typical for Texas, however.
5. Montgomery, AL
Overall Score: 81.6
If you really want to minimize your property taxes, look no further than the capital of Alabama. They’ll run you an average of just $628 per year (1st). Home prices are also pretty reasonable at $180,200 (16th), slightly under three times the local household income (16th). While the cost of living is low (89.6 RPP, 16th), inflation has hit real personal income pretty hard here (-6.8%, 137th).
6. Mobile, AL
Overall Score: 80.9
If you’re looking for something a little closer to the coast, Alabama can also offer you relatively cheap living in Mobile. Homes are a little cheaper here on average ($177,400, 15th), but more expensive relative to local incomes (3.27, 33rd) and you’ll pay a little more in property taxes ($877, 2nd). On the other hand, you’ll generally save money on goods and services (87.3 RPP, 6th).
7. Youngstown-Warren-Boardman, OH-PA
Overall Score: 80.6
Another interstate metro area historically known for steel production makes our top 10 list. These three towns form a small metro area around 60 miles to the northwest of Pittsburgh. Homes are cheap here ($142,100, 3rd) and, shockingly, in proportion to local incomes (2.61 ratios, 6th), even with inflation taking a big bite out of wages (-6.2%, 132nd). You'll want to move quickly, though, because Youngstown and company aren’t building too many new homes (55 permits per 100,000, 160th).
8. Fort Wayne, IN
Overall Score: 80.5
If you’re looking for more urban Midwestern living, you may want to consider Indiana’s second-largest city. Homes are quite affordable for a city of its size ($200,400, 31st), around three times the median household income for the region. Monthly expenditures are also some of the lowest on our list at just under $1,200 (4th).
9. Canton-Massillon, OH
Overall Score: 80.4
The two small cities, Canton and Massillon, form the backbone of this industrial region 60 miles to the south of Cleveland. Homes cost around $170,400 (9th) here and are appropriately priced relative to local household income (2.64 ratio, 8th). The cost of living is also well below the national average (88.7 RPP, 8th), but don’t expect to see too many new homes on the market (91 permits per 100,000, 140th).
10. Davenport-Moline-Rock Island, IA-IL
Overall Score: 79.5
Rounding out our top 10 cheapest places are the Quad Cities (East Moline is the fourth) in the Mississippi Valley of Iowa and Illinois. This region actually has some of the most affordable housing relative to local household income (2.45 ratio, 2nd) of all the MSAs we looked at, with the median home costing $160,700 (6th). Cost of living is also low at 88.9 RPP (10th).
The 10 Most Expensive Places To Buy A Home
158. Vallejo, CA
Score: 10.7 out of 100
Homes in Vallejo aren’t as expensive as much of the rest of the Bay Area ($605,300, 155th), coming in at a little under seven times the median household income. On the other hand, the local purchasing power of those salaries has declined tremendously in the work-from-home era (-11.5%, 164th), pushing up monthly expenditures to nearly $2,500 (154th).
159. Santa Rosa-Petaluma, CA
Overall Score: 10.3
Santa Rosa, the largest city in California’s wine country region, Santa Rosa suffers from many of the same issues as the rest of the state. With a cost-to-income ratio of 7.96 (161th), the region is wildly unaffordable to most households. Median monthly expenditures above $2,700 (158th) also leave little disposable income for all but the most wealthy.
160. Boston-Cambridge-Newton
Overall Score: 10.1
Boston and its inner suburbs are one of two expensive Northeast metros to break California’s death grip on the bottom of our affordability list. Homes are pricey ($618,000, 156th), if not California pricey, a little under six times the median household income (141st). Monthly expenditures are high ($2,741, 159th), with inflation taking a significant bite out of otherwise high local salaries (-6.3%, 134th).
161. New York-Newark-Jersey City, NY-NJ
Overall Score: 8.9
The other Northeastern metro area to make the 10 least affordable places to buy a house list is, unsurprisingly, the inner New York City metro area. What might be surprising is that it’s less due to the price of homes ($578,800, 152nd, 6.32 cost-to-income ratio, 150th) than the cost of living factors ($2,974 median monthly expenditures, 165th) and property taxes. At a median of $9,569 (166th), they’re the second most expensive of the metros on our list.
162. San Diego-Chula Vista-Carlsbad, CA
Overall Score: 8.7
The San Diego region hasn’t seen as much real person income destruction (-4.4%, 90th) as the other most expensive California cities on our list, but that’s little comfort in a place with a 114.5 RPP (165th) and monthly expenditures closing in on $3,000 (162nd). Don’t expect relief anytime soon, given how little housing San Diego is building (95 permits, 136th).
163. Santa Maria-Santa Barbara, CA
Overall Score: 8.3
This coastal metropolitan area around 100 miles northwest of Los Angeles can get you slightly better home prices ($744,700, 160th) and property taxes ($4,886, 141st), but local salaries have been severely impacted by inflation (-8%, 146th).
164. Los Angeles-Long Beach-Anaheim, CA
Overall Score: 7.6
Homes in LA aren’t as expensive as in the Bay Area, but their cost exceeds local salaries by nearly a factor of 10, the highest among all the metros we looked at (167th). Salaries have held up a little better here than much of the rest of the state (-4.7%, 96th), though that’s little solace for households that see median monthly expenditures of nearly $3,000 (163th).
165. San Francisco-Oakland-Berkeley, CA
Overall Score: 5.7
When it comes to affordability, what can we say about the Bay Area that hasn’t already been said? Median home prices over $1.1 million (166th)? The highest RPP in the US (117.9, 167th)? Punishing median property taxes ($9,259, 165th)? Better to ask why this region didn’t take the No. 1 slot. Real-person income didn’t decline quite as badly (-5.8%, 125th) here as in other parts of the Golden State, and there is some housing being built (171 per 100,000, 112th).
166. Oxnard-Thousand Oaks-Ventura, CA
Overall Score: 5.5
This ritzy region to the immediate northwest of Los Angeles is the fourth most expensive place to buy a house. You’ll pay a premium for goods and services (114.4 RPP, 164th), with median household expenditures of $2,817 (160th). Home affordability isn’t quite as bad as some of the other worst offenders in California, but it still runs 7.76 times the median household income (159th).
167. San Jose-Sunnyvale-Santa Clara, CA
Overall Score: 1.5
San Francisco may make the news more often, but it turns out that the southern end of the Bay Area is actually a more costly place to buy a home. In fact, it’s the most expensive place to buy a home in the US. The median home is more expensive here than anywhere else, clocking in at $1.4 million (167th), 9.55 times the average household income (166th). San Jose and its neighbors also lead in median property taxes, which run over $250,000 (167th), as well as monthly household expenses ($3,942, 167th).
Making matters worse, real personal income collapsed here by nearly 10% (160th) in 2022.
Methodology
To create our rankings, we collected data on 384 metropolitan statistical areas (MSA) in the US. For our rankings, we limited our scope to MSAs with populations over 300,000. To get a sense of how cheap it is to buy a house in each of those markets, we selected seven metrics. For each metric, the MSA was given a rank of 1 to 167, with the best-performing MSA receiving a ranking of 1. Rankings were then normalized and multiplied by a selected weight to create an aggregate score out of 100.
The seven metrics we chose, along with their weights, were:
- Regional Price Parity (10%): Regional price parity (RPP) measures differences in the costs of goods and services as a percentage of overall national price levels. A regional price parity of 100 would indicate prices for the area are around the national average. An RPP of 110 would indicate that regional average prices are higher than the national average, while an RPP of 90 would indicate they are lower. Data was drawn from the Bureau of Economic Analysis’s Real Personal Consumption Expenditures and Real Personal Income By State and Metropolitan Area, 2022 report.
- Change In Real Personal Income (10%): This metric measures the change in the amount of money individuals in the region earned from 2021 to 2022, accounting for inflation. Declining purchasing power in a region can be a leading indicator that current housing prices may not be sustainable. Data was drawn from the Bureau of Economic Analysis’s Real Personal Consumption Expenditures and Real Personal Income By State and Metropolitan Area, 2022 report (linked above).
- Median Property Taxes (15%): Property taxes represent an ongoing annual cost of home ownership, even after its mortgage is paid off. Data is for 2022 and was drawn from the US Census Bureau’s American Community Survey.
- Median Home Value (23%): Roughly 50% of single-unit homes in the region are priced above and 50% below the MSA’s median home value. This metric is presented separately from the cost-to-income ratio as a way to compare raw housing costs between MSAs. Data is for 2022 and was drawn from the US Census Bureau’s American Community Survey.
- Housing Permits Per 100,000 Resident (7%): This metric represents the amount of single-family housing unit building permits that have been awarded within the MSA, divided by the MSA’s population and then multiplied by 100,000. Housing permits are a leading indicator of construction activity and can serve as a gauge of the amount of housing stock that will become available in the near future. Data is preliminary for 2023 and drawn from the US Census Bureau’s Building Permit Survey.
- Cost-To-Income Ratio (25%): This metric is the median cost of a home in the MSA divided by the median household income within the MSA. It measures how affordable a home is relative to local salaries. MSAs with high cost-to-income ratios have higher upward pressure on home prices. Data is for 2022 and was drawn from the US Census Bureau’s American Community Survey.
- Median Monthly Expenditures (10%): This metric compares typical monthly household expenditures in each MSA and is another way of measuring the cost of living in the region. Data is for 2022 and was drawn from the US Census Bureau’s American Community Survey.