

Table of contents
High inflation, stubborn underemployment in coastal blue states, and slowing growth in red states are raising the specter of stagflation in the U.S.
Stagflation, a term for a stubborn economic condition characterized by high inflation, high unemployment, and sluggish economic growth, was last seen in the U.S. in the 1970s. While current conditions aren’t nearly as grim, the combination of higher-than-normal inflation and slow hiring is raising concerns that we could be headed towards something similar.
Stagflationary recessions, like the one the U.S. experienced between 1973 and 1975, can lead to prolonged economic stagnation and are difficult to address with monetary policy. These types of recessions are characterized by both higher prices, including on shelter, and high unemployment.
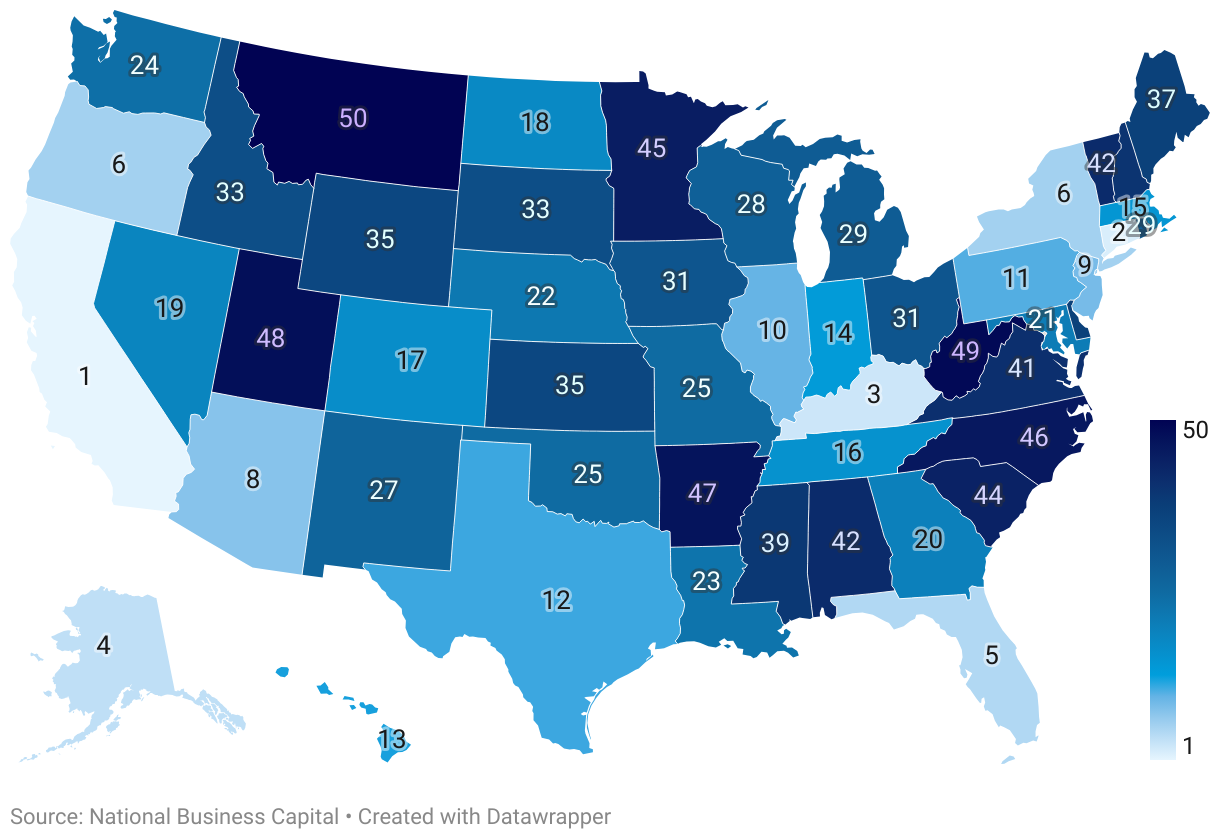
In its inaugural report, The U.S. States Most Vulnerable To Stagflation in 2025, NationalBusinessCapital.com looked at state and regional data to determine which states might be closest to entering a stagflationary swamp. Researchers found the strongest stagflationary tremors along the West Coast, but there are concerning signs in other regions as well.
Much of the pain along the Pacific and in the Northeast can be attributed to high shelter costs, large utility bills, and high (U6) underemployment. These issues were most pronounced in California (1st), which tops the list by a comfortable lead, but they are also apparent in states like Connecticut (2nd), Oregon (6th, tied), New York (6th, tied), and New Jersey (9th). Red states like Kentucky (3rd), however, face their own stagflationary risks in the form of slowing GDP growth, inadequate salaries, and/or low productivity growth.
Despite showing some signs of a slowing economy earlier this year, Montana (50th) emerged as the state least at risk of entering stagflation thanks to relatively low inflation and underemployment, along with fellow landlocked states West Virginia (49th), Utah (48th), Arkansas (47th), Minnesota (45th), and Vermont (42nd, tied). Those looking for safety within view of the beach may want to consider North Carolina (46th), South Carolina (44th), or Alabama (42nd, tied).
Key Findings
- Blue States Are Showing More Stagflationary Indicators Overall: Blue states had an average overall stagflationary score of 53.4, 6.5% higher than red states, which had an overall score of 50.1. Blue states, led by California, accounted for 60% of all states in the 10 most at-risk ranking. This is, in large part, due to blue states having more inflation overall, particularly when it comes to shelter and energy costs. Blue states are also struggling more with underemployment, with an average U6 unemployment rate of 7.5% to red states’ 6.8%.
- But Household Budgets And Recent Economic Growth Are Under More Stress In Red States: While blue states generally had higher inflation, the citizens of red states may have less capacity to absorb price increases, often attributable to lower incomes. Around 38% of red state households reported difficulty paying bills compared to around 34% of blue state households. Credit card delinquency is also more common in red states. Red states also saw more severe real GDP losses (-1.14% to blue states’ -0.83%) during 2025’s sluggish Q1, as well as lower labor productivity growth in 2024 (2% vs. 2.8%).
- Pacific States Are Showing The Most Stagflationary Signs: Regionally, Pacific States had the highest average stagflationary score by a considerable margin at 60.6, followed by the Northeast (53.1), Midwest (50.5), South (49.2), and Mountain (48.45) regions.
- Over 25% Of Households In Every State Say They Are Struggling To Pay Bills: An average of 36.3% households in the U.S., more than 1-in-3, are reporting difficulty paying monthly bills. Minnesota had the least stressed households at 27.4% while Kentucky had the most at 45.6%.
THE 10 STATES MOST AT RISK OF STAGFLATION IN 2025
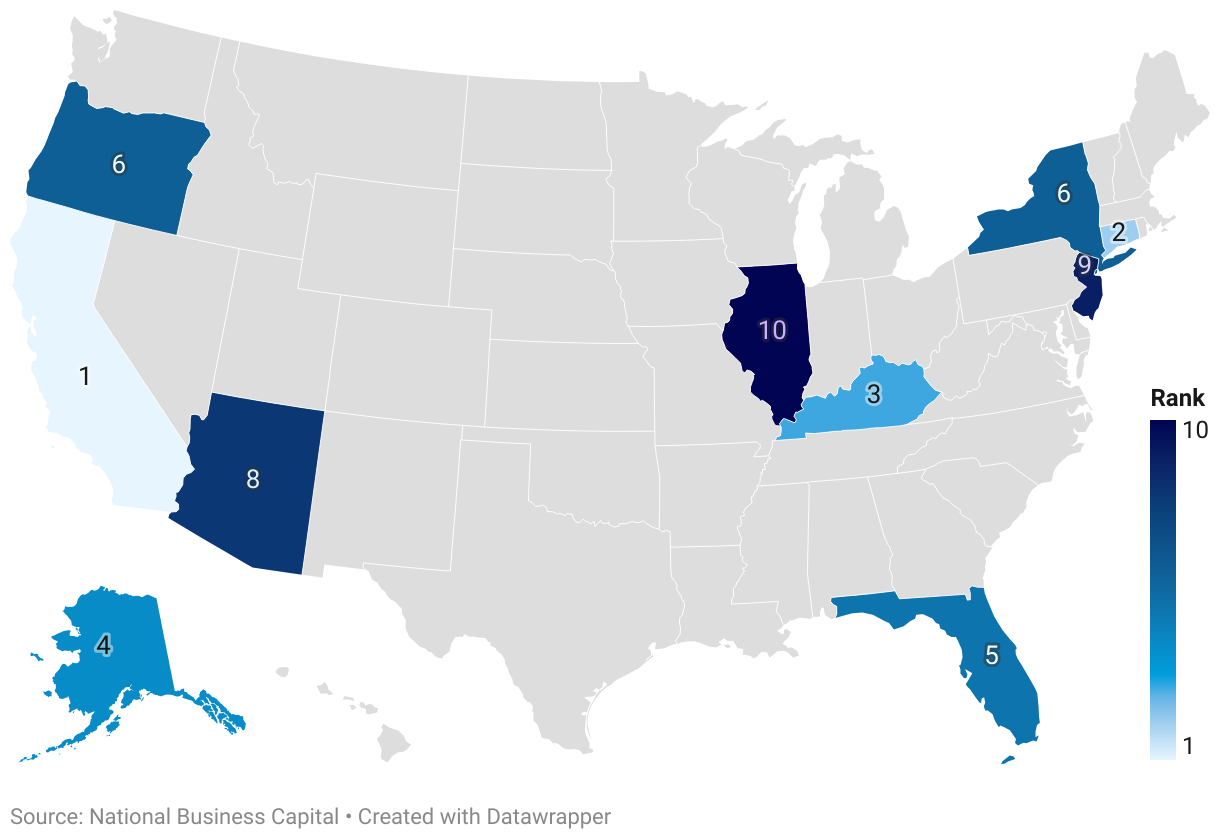
1. California

Score (out of 100): 69.0 (1st)
Despite having a GDP nearly 50% larger than Texas, the second-largest economy in the U.S., California has walked with a limp since the pandemic. With the highest U6 unemployment rate in the nation (10%), Californians are struggling to find work (3.8% job opening rate, 3rd lowest) that keeps up with some of the stickiest inflation in the country (135.7 implicit deflator, 1st; 2.7% regional CPI, 10th) and some of its least affordable real estate. While the populations of some other states are deeper in the red, credit card delinquencies (12%, 12th) are relatively high, as are households reporting difficulty paying bills (37.9%, 16th).
One glimmer of hope for the Golden State when it comes to avoiding a stagflationary rut: California’s productivity gains in 2024 were among the highest in the nation, 3.9% (45th in productivity loss).
2. Connecticut
Score: 64.3 (2nd)
Things have been getting pretty expensive in the Constitution State. Personal expenditures are way up (5.2%, 4th) as is inflation (2.8% regional CPI, 1st; 124.9 implicit deflator, 10th). Unlike California, Connecticut’s stagflationary risks aren’t as immediate, but the state may have less wiggle room to dig its way out should it arrive. Personal income growth has taken out some of the sting (4.7%, 46th), but trouble could be on the horizon as the state’s productivity (1.7% growth, 17th worst) gains lag behind much of the nation.
So far, Connecticut’s underemployment is on the high side (7.4% U6, 20th) without being especially notable, but that could change given relatively low job opening rates (4.4%, 13th lowest).
3. Kentucky

Score: 64.1 (3rd)
Unlike the top two states, Kentucky has suffered comparitively mild rates of inflation (109 implicit deflator, 37th; 2.4% regional CPI, 20th). Unfortunately, Kentuckians have a very limited capacity to absorb price increases, with 45.6% percent of households reporting difficulty paying their bills (1st). Personal income growth is among the lowest in the nation (0.3%, 7th), and underemployment is relatively common (8.3%, 9th). With productivity gains lower than most other states (1.5%, 14th lowest) and tepid job growth (4.6% job opening rate, 20th lowest), Kentucky’s modest inflation risks becoming stagflationary.
4. Alaska

Score: 63.5 (4th)
Income growth in real dollars has recently stalled out in the Last Frontier, increasing just 0.3% (7th worst) between 2022 and 2023, a worrisome trait in a state with above-average inflation (122.6 implicit deflator, 12th; 2.7% regional CPI). Part of the problem may be underemployment, with 8.4% of the population (6th) lacking gainful work and recent declines in real GDP (-1.8%, 11th lowest), thanks in part to low oil prices.
Despite the somewhat gloomy outlook, Alaskan households don’t seem as stressed as many of those in the lower 48, with 32.3% reporting difficulty paying bills (42nd worst). High job opening rates (5.6%, 46th worst) may also portend an improving job market.
5. Florida

Score: 62.7 (5th)
Once considered a bargain, the Sunshine State isn’t as cheap as it used to be (124.7 implicit deflator, 11th). Floridians appear to be struggling to absorb the higher cost of living, with the second-highest rate of credit card delinquencies in the nation (13.5%) and 41.1% of households reporting difficulty paying bills (10th). Despite GDP gains (1.4%), Florida is still largely dependent on tourism and a steady influx of newcomers, showing a depressed job opening rate (3.7%, 2nd worst) and sluggish productivity growth (1%, 9th worst).
Incomes are up in Florida (3%, 35th worst), however, which may ease some of the pain as the state’s real estate market cools off.
6. Oregon

Score: 61.8 (6th, tied)
Like the rest of the Pacific Coast, Oregon’s inflationary pressures have outpaced most of the rest of the country (126.2 deflator, 8th; 2.7% regional CPI, 10th). Higher costs are compounded by underemployment (8.4% U6, 6th) and relatively low productivity gains (1.3%, 11th worst). The Beaver State, like most other states, also saw real GDP decline earlier in the year (-1.5%, 16th).
So far households don’t appear to be taking on too much debt, however. Oregon has one of the lower credit card delinquency rates (8.5%, 44th), with 33.6% of households reporting difficulty paying bills (37th).
6. New York

Score: 61.8 (6th, tied)
On the other side of the country, New York ties Oregon as the sixth most vulnerable state to stagflation. Inflation is proving to be quite sticky in the Empire State (129.7 implicit deflator, 6th; 2.8% regional CPI, 1st), particularly in the metro area, where shelter costs have sharply rebounded from their temporary pandemic lows. Underemployment (7.9%, 12th worst) is a significant issue, especially in light of rising prices.
While not too many other indicators are flashing red, there also aren’t too many things that suggest a reversal of fortune is incoming, with the exception of fairly strong labor productivity growth (2.9%, 33rd worst).
8. Arizona
Score: 61.2 (8th)
Arizonians may have been living above their means, with one of the highest rates of credit card delinquency (12.5%, 5th) in the U.S. While inflation hasn’t hit the Grand Canyon state quite as hard as the coasts, it still tracks above the national average (121.8 implicit deflator, 15th) and some of its neighbors. Throw in lagging productivity gains (1.1%, 10th) and relatively high underemployment (7.7%, 15th), and starts to look like a state that, while not currently dealing with stagflation, could get there with sufficient headwinds.
9. New Jersey

Score: 60.6 (9th)
Inflation has been hitting the Garden State even harder (131.2 implicit deflator, 2nd; 2.8% regional CPI, 1st) than the other side of the Lincoln Tunnel. New Jerseyans face only marginally less underemployment (8.3%, 9th) than New Yorkers, suggesting some regional reluctance to hire full-time. Modest productivity gains (1.9%, 22nd worst) mean the turnpike out of the doldrums may be long, even with a decent job opening rate (4.9%, 32nd worst).
New Jerseyans appear to be taking it in stride so far, however, and avoiding the temptation to run up credit card debt (8.9%, 39th highest).
10. Illinois

Score: 59.8 (10th)
Stagflation isn’t necessarily stalking Illinois, but there are some causes for concern. Illinois saw a significant slump in real GDP (-2.2%, 9th worst) in Q1 of 2025, and many job seekers are stuck with part-time or gig work (8.5% U6, 5th highest) with a job opening rate of 4.3% (12th lowest). Inflation has been on the high side (119.1 implicit deflator, 18th; 2.5% regional CPI, 15th), though it doesn’t seem to be busting budgets as badly as it could (8.8% credit card delinquency rate, 41st highest).
Things may be looking up for Illinois, however, given strong income (4.6%, 40th lowest) and productivity growth (3%, 34th lowest).
THE 10 STATES LEAST IN DANGER OF STAGFLATION IN 2025
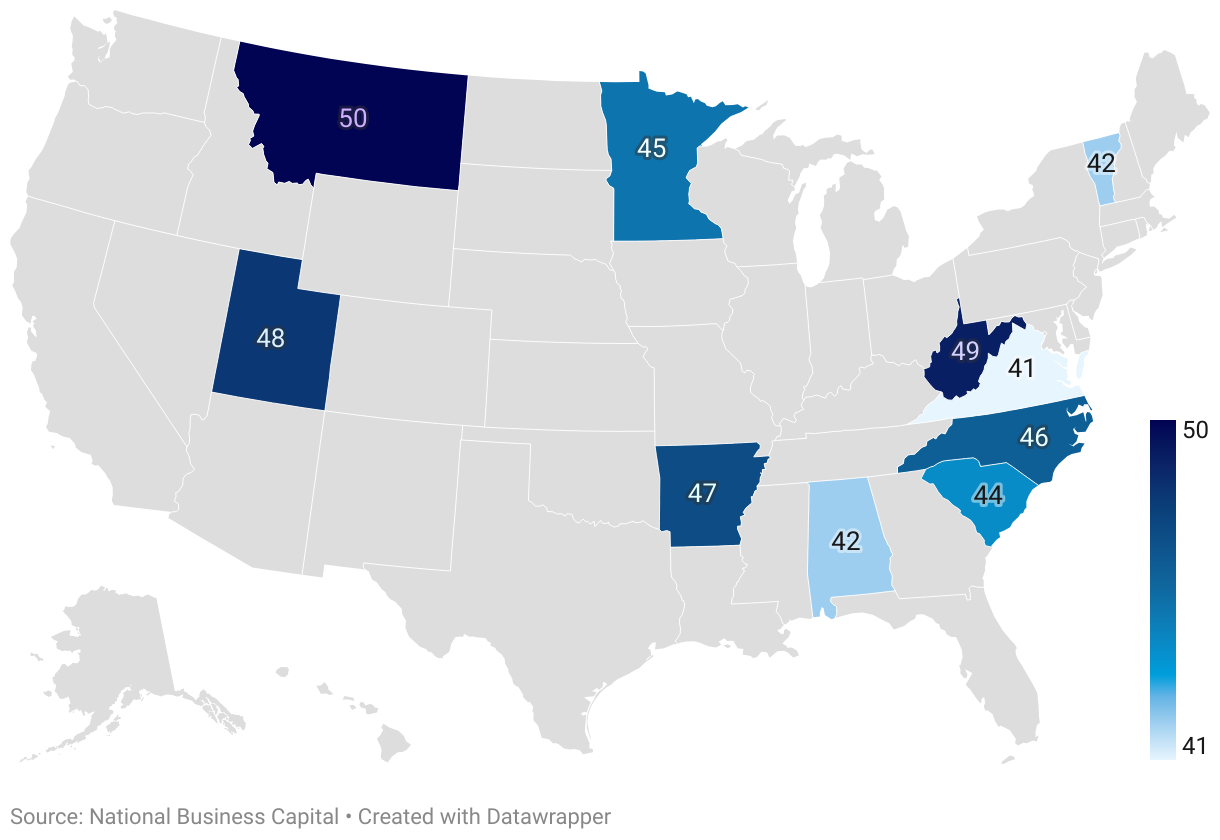
41. Virginia
Score: 45.1 (out of 100)
Strong productivity gains (3%, 34th lowest) and low underemployment (6.7%, 32nd) are delivering strong enough income growth (3.8%, 41st lowest) to offset Virginia’s relatively high inflation (121.4 implicit deflator, 16th).
42. Alabama
Score: 43.9, tied
Inflation has been relatively mild in Alabama (108.4 implicit deflator, 41st). It’s also one of the few states to see GDP gains in Q1 of 2025 (1%, 48th lowest), though stressed household budgets (44.1%, 5th) and stagnant productivity (0%, 2nd lowest) remain an issue.
42. Vermont
Score: 43.9, tied
Vermonters have seen strong wage growth (6%, the highest in the nation in chained dollars) and have been able to find full-time work (5.1% job opening rate, 38th; 5.1% U6, 48th). This has helped soak up the high CPI inflation (2.8% CPI) plaguing the Northeast.
44. South Carolina
Score: 42.2
South Carolina saw the highest GDP growth of any state in Q1 of 2025 (1.7%) and continues to see solid job opening rates (4.9%, 32nd lowest) and labor productivity gains (3.7%, 43rd). High credit card delinquency rates (12.1% 11th) may hint at some mounting stress, however.
45. Minnesota
Score: 41.2
Minnesota is home to the least financially stressed households in the nation (27.4%) and has low rates of credit card delinquency to boot (7.9%, 48th). Job growth (5.6%, 46th lowest) and productivity (3.5%, 37th lowest) are also strong. Personal income growth has been lagging in real dollars, however, (-0.6, 3rd lowest).
46. North Carolina
Score: 40.8
North Carolinians are putting a lot of purchases on their cards (14.5% delinquency rate, 1st), but strong job growth (5.7%, 49th lowest) and productivity (3.7%, 43rd lowest) may help households avoid the really deep waters.
47. Arkansas
Score: 39.8
It’s hard to have stagflation without a lot of inflation (104.2 implicit deflator, 50th; 1.4% regional CPI, 47th), though financially stressed households in Arkansas may struggle to absorb unexpected, nationwide shocks (39.4% report trouble paying bills, 14th; 12.1% credit card delinquency rate, 10th) should they occur.
48. Utah
Score: 37.8
Utah was one of a handful of states to see GDP gains in Q1 (0.5%, 44th lowest) and has generally seen decent income growth (2.3%, 31st lowest) with around average levels of inflation. Job growth is on the low side, however (4.4%, 13th lowest).
49. West Virginia
Score: 36.3
With some of the most affordable homes in the nation, inflation in West Virginia has been relatively mild (108.2 implicit deflator, 43rd; 2.2% regional CPI, 31st). It also has the highest job opening rate in the nation at 6%, with respectable productivity gains (3.5%, 37th lowest). Income growth, however, has lagged (0.6%, 9th lowest).
50. Montana
Score: 35.1
Big Sky Country gets a mostly clean bill of health when it comes to stagflation risk, with relatively low inflation (108.7 deflator, 40th; 1.7% regional CPI, 39th) and solid wage growth (2.5%, 33rd lowest), though Q1’s GDP slump hit Montana harder than most states (-4.4, 3rd).
COMPLETE RANKING OF ALL 50 STATES
Methodology
To create our rankings, we used 10 metrics to get a sense of how close a state is to entering a stagflationary rut. For each metric, states were assigned a rank (1 to 50). A rank of 1 meant a state was showing more stagflationary characteristics within that metric than other states. A rank of 50 meant it was showing less than other states. All scores were then normalized and aggregated together to create an overall score and ranking.
The 10 metrics, each of which was weighted 10% are:
- % Change in Personal Expenditures: This metric attempts to capture inflationary changes, in real dollars, based on consumer spending within the state. The percent change is from 2022 to 2023 and is sourced from the U.S. Bureau of Economic Analysis.
- % Change in Personal Income: This metric gauges changes in individuals’ spending power within the state, adjusted for inflation. Data is sourced from the Bureau of Economic Analysis and measures the change between 2022 and 2023.
- Implicit Deflator: This metric tracks changes in the price of new, domestically produced goods and services within a state’s economy. It’s a ratio calculated by dividing nominal GDP (current dollars) by real GDP (constant dollars) and multiplying the result by 100. A higher implicit deflator indicates more overall inflation. Data is sourced from the Bureau of Economic Analysis and measures changes between 2022 and 2023.
- Regional CPI: This metric measures changes in a basket of selected goods and services within a state’s region of the U.S. and is often used as a measure of inflation. Data is for the 12-month period ending March 2024 and is sourced from the U.S. Bureau of Labor Statistics.
- % Households Reporting Difficulty Paying Bills: This metric is the percentage of households that reported difficulty paying their bills during the Aug. 20, 2024, to Sept. 16, 2024, U.S. Census Pulse Survey. It is a measure of overall financial stress on households within the state.
- Credit Card Delinquency Rate: This metric is another indicator of household financial stress. A credit card is considered delinquent when it is 30 days or more past due. Data is for Q4 of 2024 and is sourced from the Federal Reserve Bank of New York.
- Change in Real GDP: This metric is the change in GDP for each state, in real dollars, in Q1 of 2025. It is a measure of overall economic activity within the state, controlled for population. Data is sourced from the Bureau of Economic Analysis.
- U6 Unemployment Rate: While the U3, which counts people who are actively seeking work, is the official unemployment rate, U6 also captures underemployed and discouraged workers who may be structurally locked out of a stagflationary economy with limited full-time hiring. This metric is the average U6 employment rate from Q2 of 2024 through Q1 2025 and is sourced from the Bureau of Labor Statistics.
- Job Opening Rate: This metric is a gauge of seasonally adjusted job growth within a state. Data is for April 2025 and is sourced from the Bureau of Labor Statistics.
- Change in Labor Productivity: Whereas wage growth with increased productivity isn’t typically inflationary, low labor productivity can indicate higher production costs per hour of work, a contributor to stagflation. Data is for 2024 and is sourced from the Bureau of Labor Statistics.

Stay informed,
stay ahead
Business news, insights, and data, delivered weekly to your inbox