


Table of contents
The weather might be frigid, but the job market in some of the coldest states in the nation are on fire….with jobs, that is.
NationalBusinessCapital.com’s inaugural report: States With the Highest Job Growth in 2024, found generally stronger conditions for quality job growth in the colder half of the country, with states like Alaska, Minnesota, Wyoming, and New Hampshire leading. These states are not only seeing job openings at a high rate, but tend to produce jobs with higher wages (or wages high relative to the cost of living) in industries like advanced manufacturing, resource extraction, and finance as opposed to retail services.
While Snow Country may be leading the nation, the news isn’t exactly bad in the rest of the country. With the exception of only two states, Mississippi and Rhode Island, employment grew throughout the U.S. from 2022 to 2023, and while job growth does appear to be slowing, there’s still a significant demand for labor across the board.
Whether this relatively strong growth will continue deep into 2024 still depends on some x-factors, notably whether the economy can continue to dodge a post-pandemic boom recession. It also remains to be seen whether AI can, indeed, obsolete certain categories of knowledge work.
Key Findings
- Cold States Dominate Near-Term Job Prospects: The South has been the biggest beneficiary of domestic migration in recent years, but it may be experiencing some drag when compensation and population growth are factored in. In the meantime, states scattered throughout the North appear to generally be creating higher-paying jobs at a faster rate relative to the size of their population, relying more heavily on established industries. That said, Georgia did make the top 10 thanks to both strong growth and above-average compensation. Louisiana and South Carolina, both of which had very high job opening rates, came close.
- Secondary Cities Take The Spotlight: In contrast to the dominance of major “hub” cities in the ’90s and ’00s, we’re now seeing better job growth metrics in states with large but not quite megacities. These are cities, such as the Washington suburbs or Manchester, NH, that may be growing, in part, due to remote workers seeking urban amenities in states with overall lower costs of living.
- The Weakest States Have Unique Problems: The bottom 10 states range from Hawaii in the distant west to New York in the East, with the majority adjacent to the Mississippi River or a state away from it. This Mississippi cluster appears largely coincidental, although it’s worth noting that many of these states are neither great gainers nor losers of population during the pandemic/work-from-home migrations of the past few years. Overall, however, the strengths and weaknesses of these states varied significantly.
- Employment Grew Over The Last Year In All But Two States: While some states have been creating jobs at a faster rate than others, employment was up in almost every state but Mississippi and Rhode Island.
TOP 10 STATES FOR JOB GROWTH 2024
1. Alaska

Score (out of 50): 11.1
The Final Frontier is still calling. With a job opening rate of 7.6% (2nd), strong average salaries (9th), and median household income (11th), Alaska has substantial opportunities for those willing to brave the cold, with particularly high wages for medical professionals, architects, engineers and, of course, oil workers. The one dark spot is Alaska’s relatively low employment rate (30th) and unimpressive pay for lower-level service industries.
2. Maryland

Overall Score: 14.2
With its high wages (6th) and household incomes (2nd), Maryland is a great place to be employed, and with an employment rate of 63.7% (10th), it’s relatively good at finding jobs for its population. Being next door to Washington, D.C., Maryland’s job market includes federal positions in institutions like the National Institute of Health, healthcare, and education. While the job opening rate in the Old Line State is pretty good (16th), the state is still shaking off some of the Northeast’s doldrums when it comes to recent hiring (27th).
3. Minnesota

Overall Score: 14.9
The North Star State has one of the highest employment rates in the country at 65.7% (4th), with fairly good compensation to boot (13th in mean salary and in median household income). While the state’s economy has shifted towards service industries in recent years, manufacturing and agriculture remain important industries. Minnesota has lagged a little below the median in hiring, however, over the last year, with a 1.4% growth in nonfarm employment (31st).
4. New Hampshire
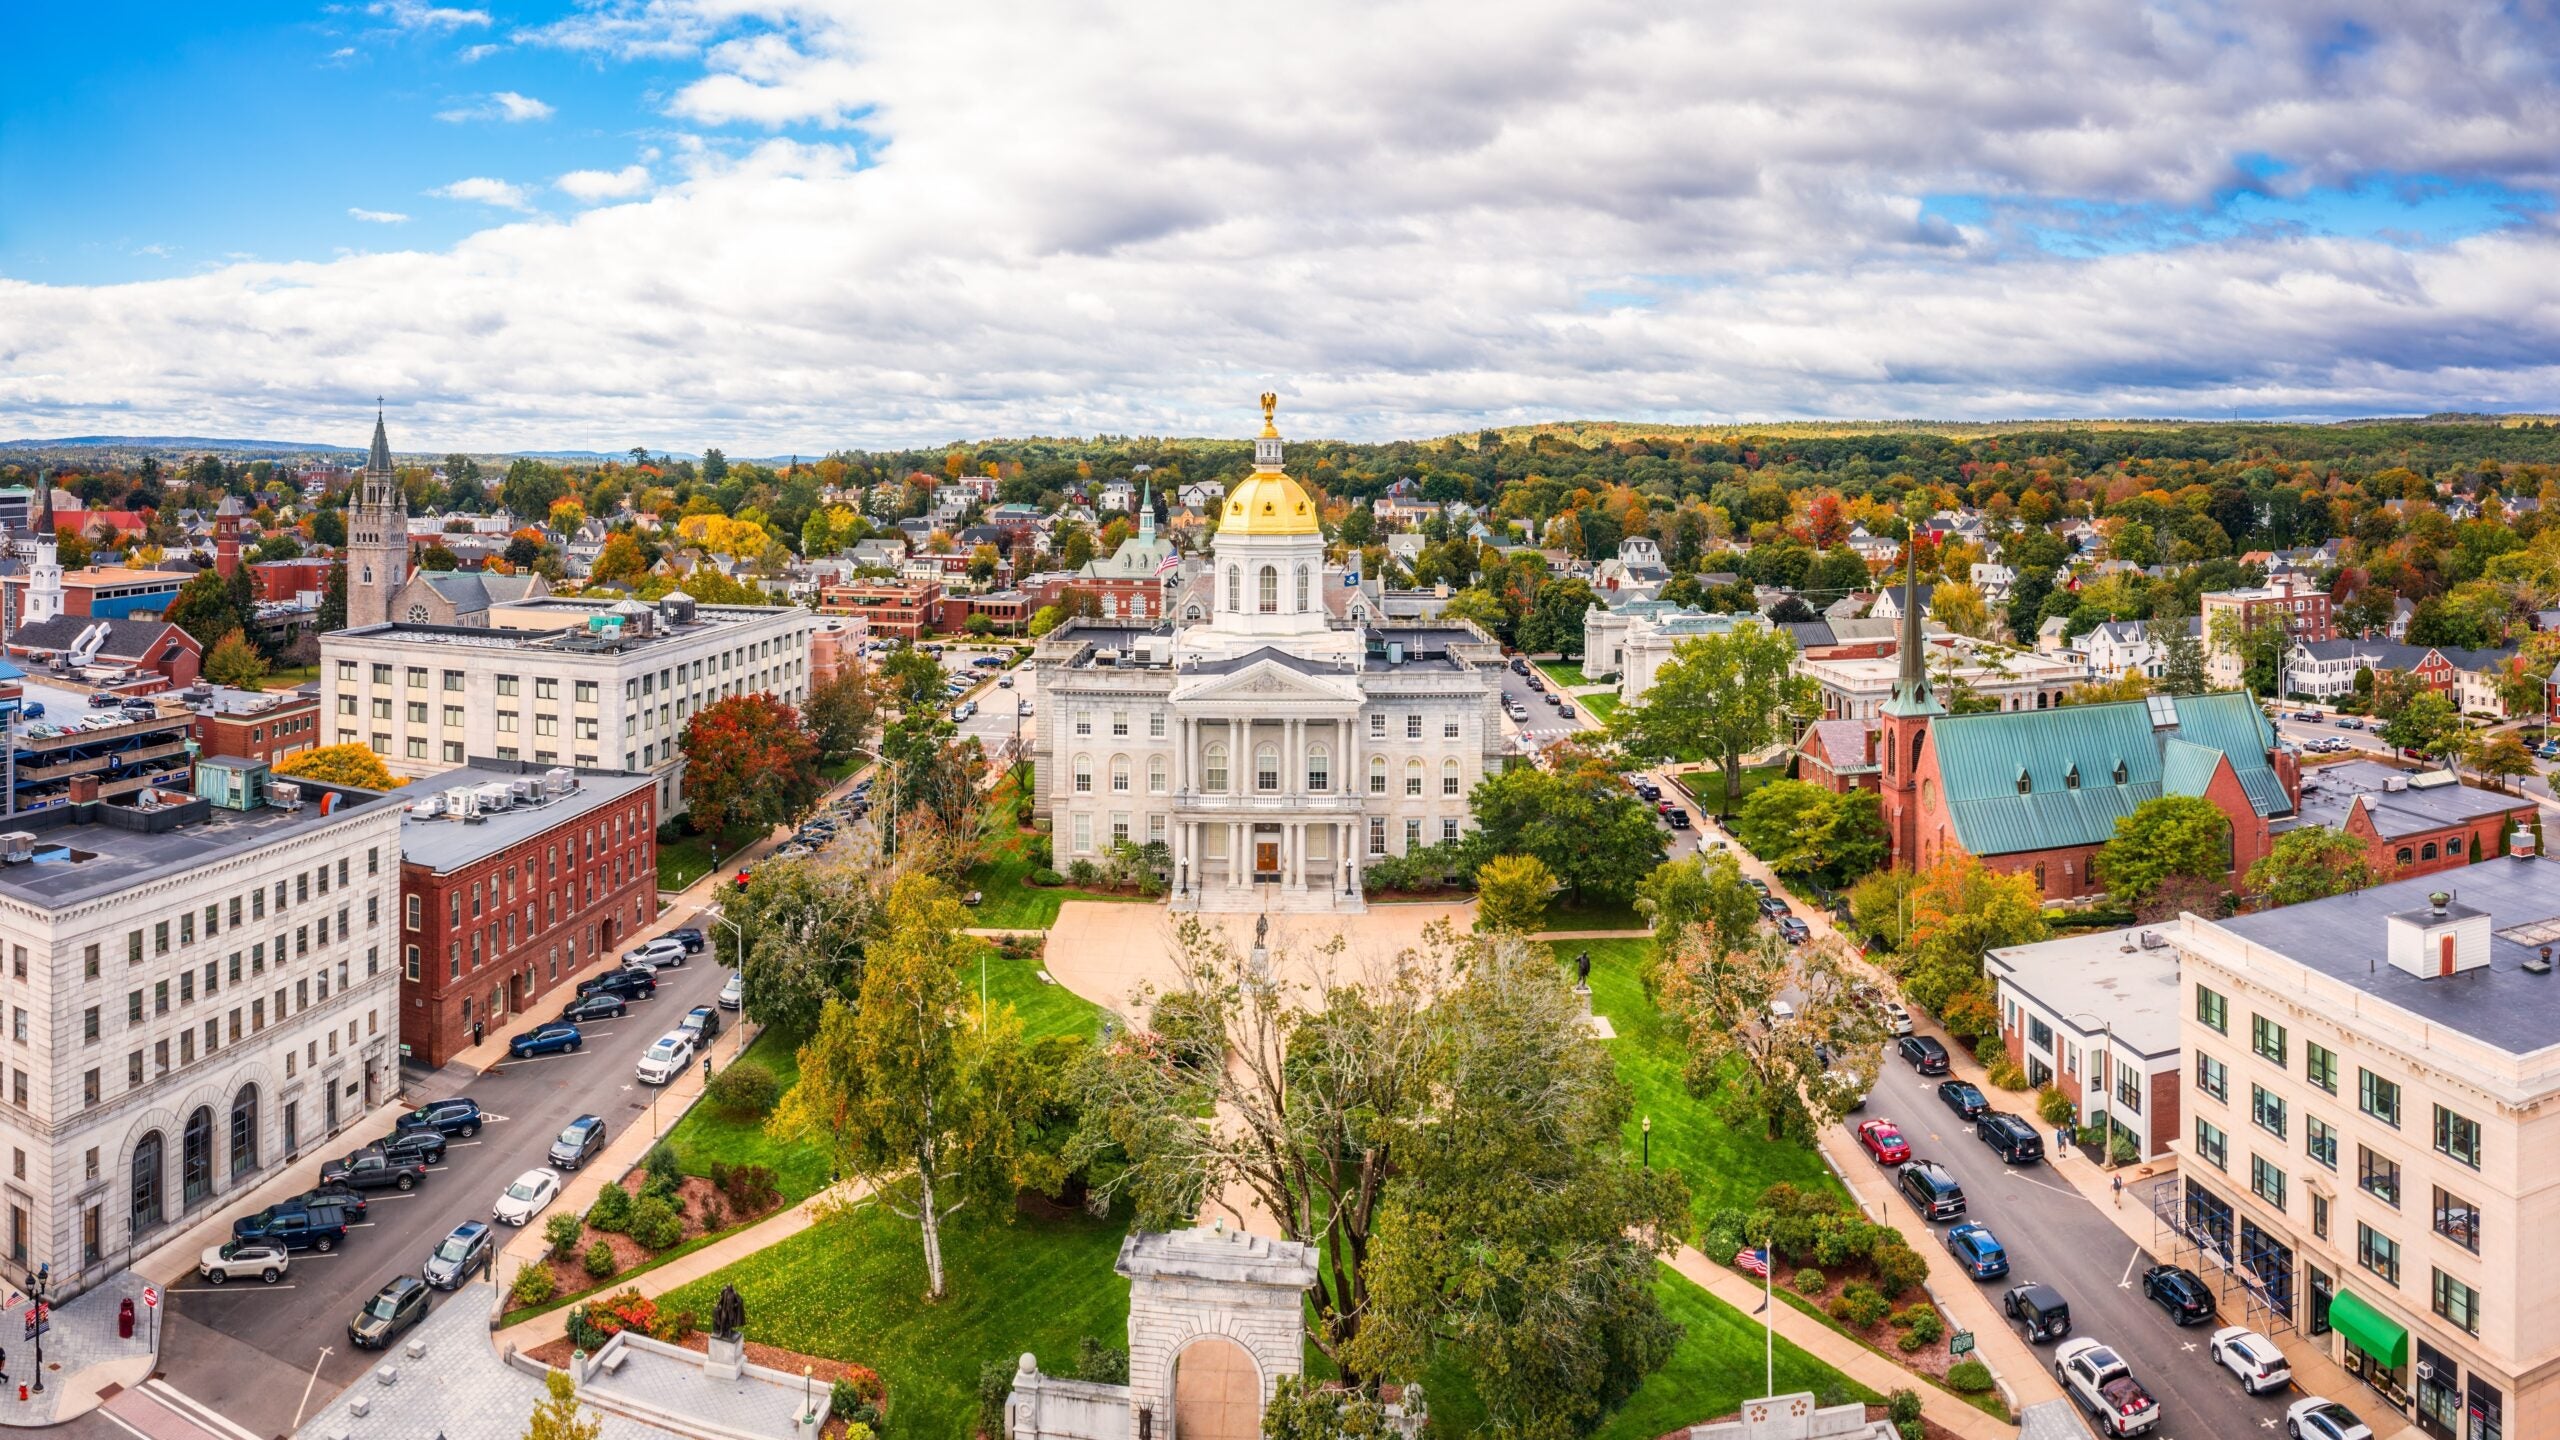
Overall Score: 15.2
The quirky Granite State comes in at number four with relatively strong showings in each of our metrics, particularly median household income (7th) and employment rate (9th). New Hampshire benefits from its proximity to–and lower cost of living than–Boston but also offers homegrown employment in industries like education, healthcare, and insurance.
5. Wyoming
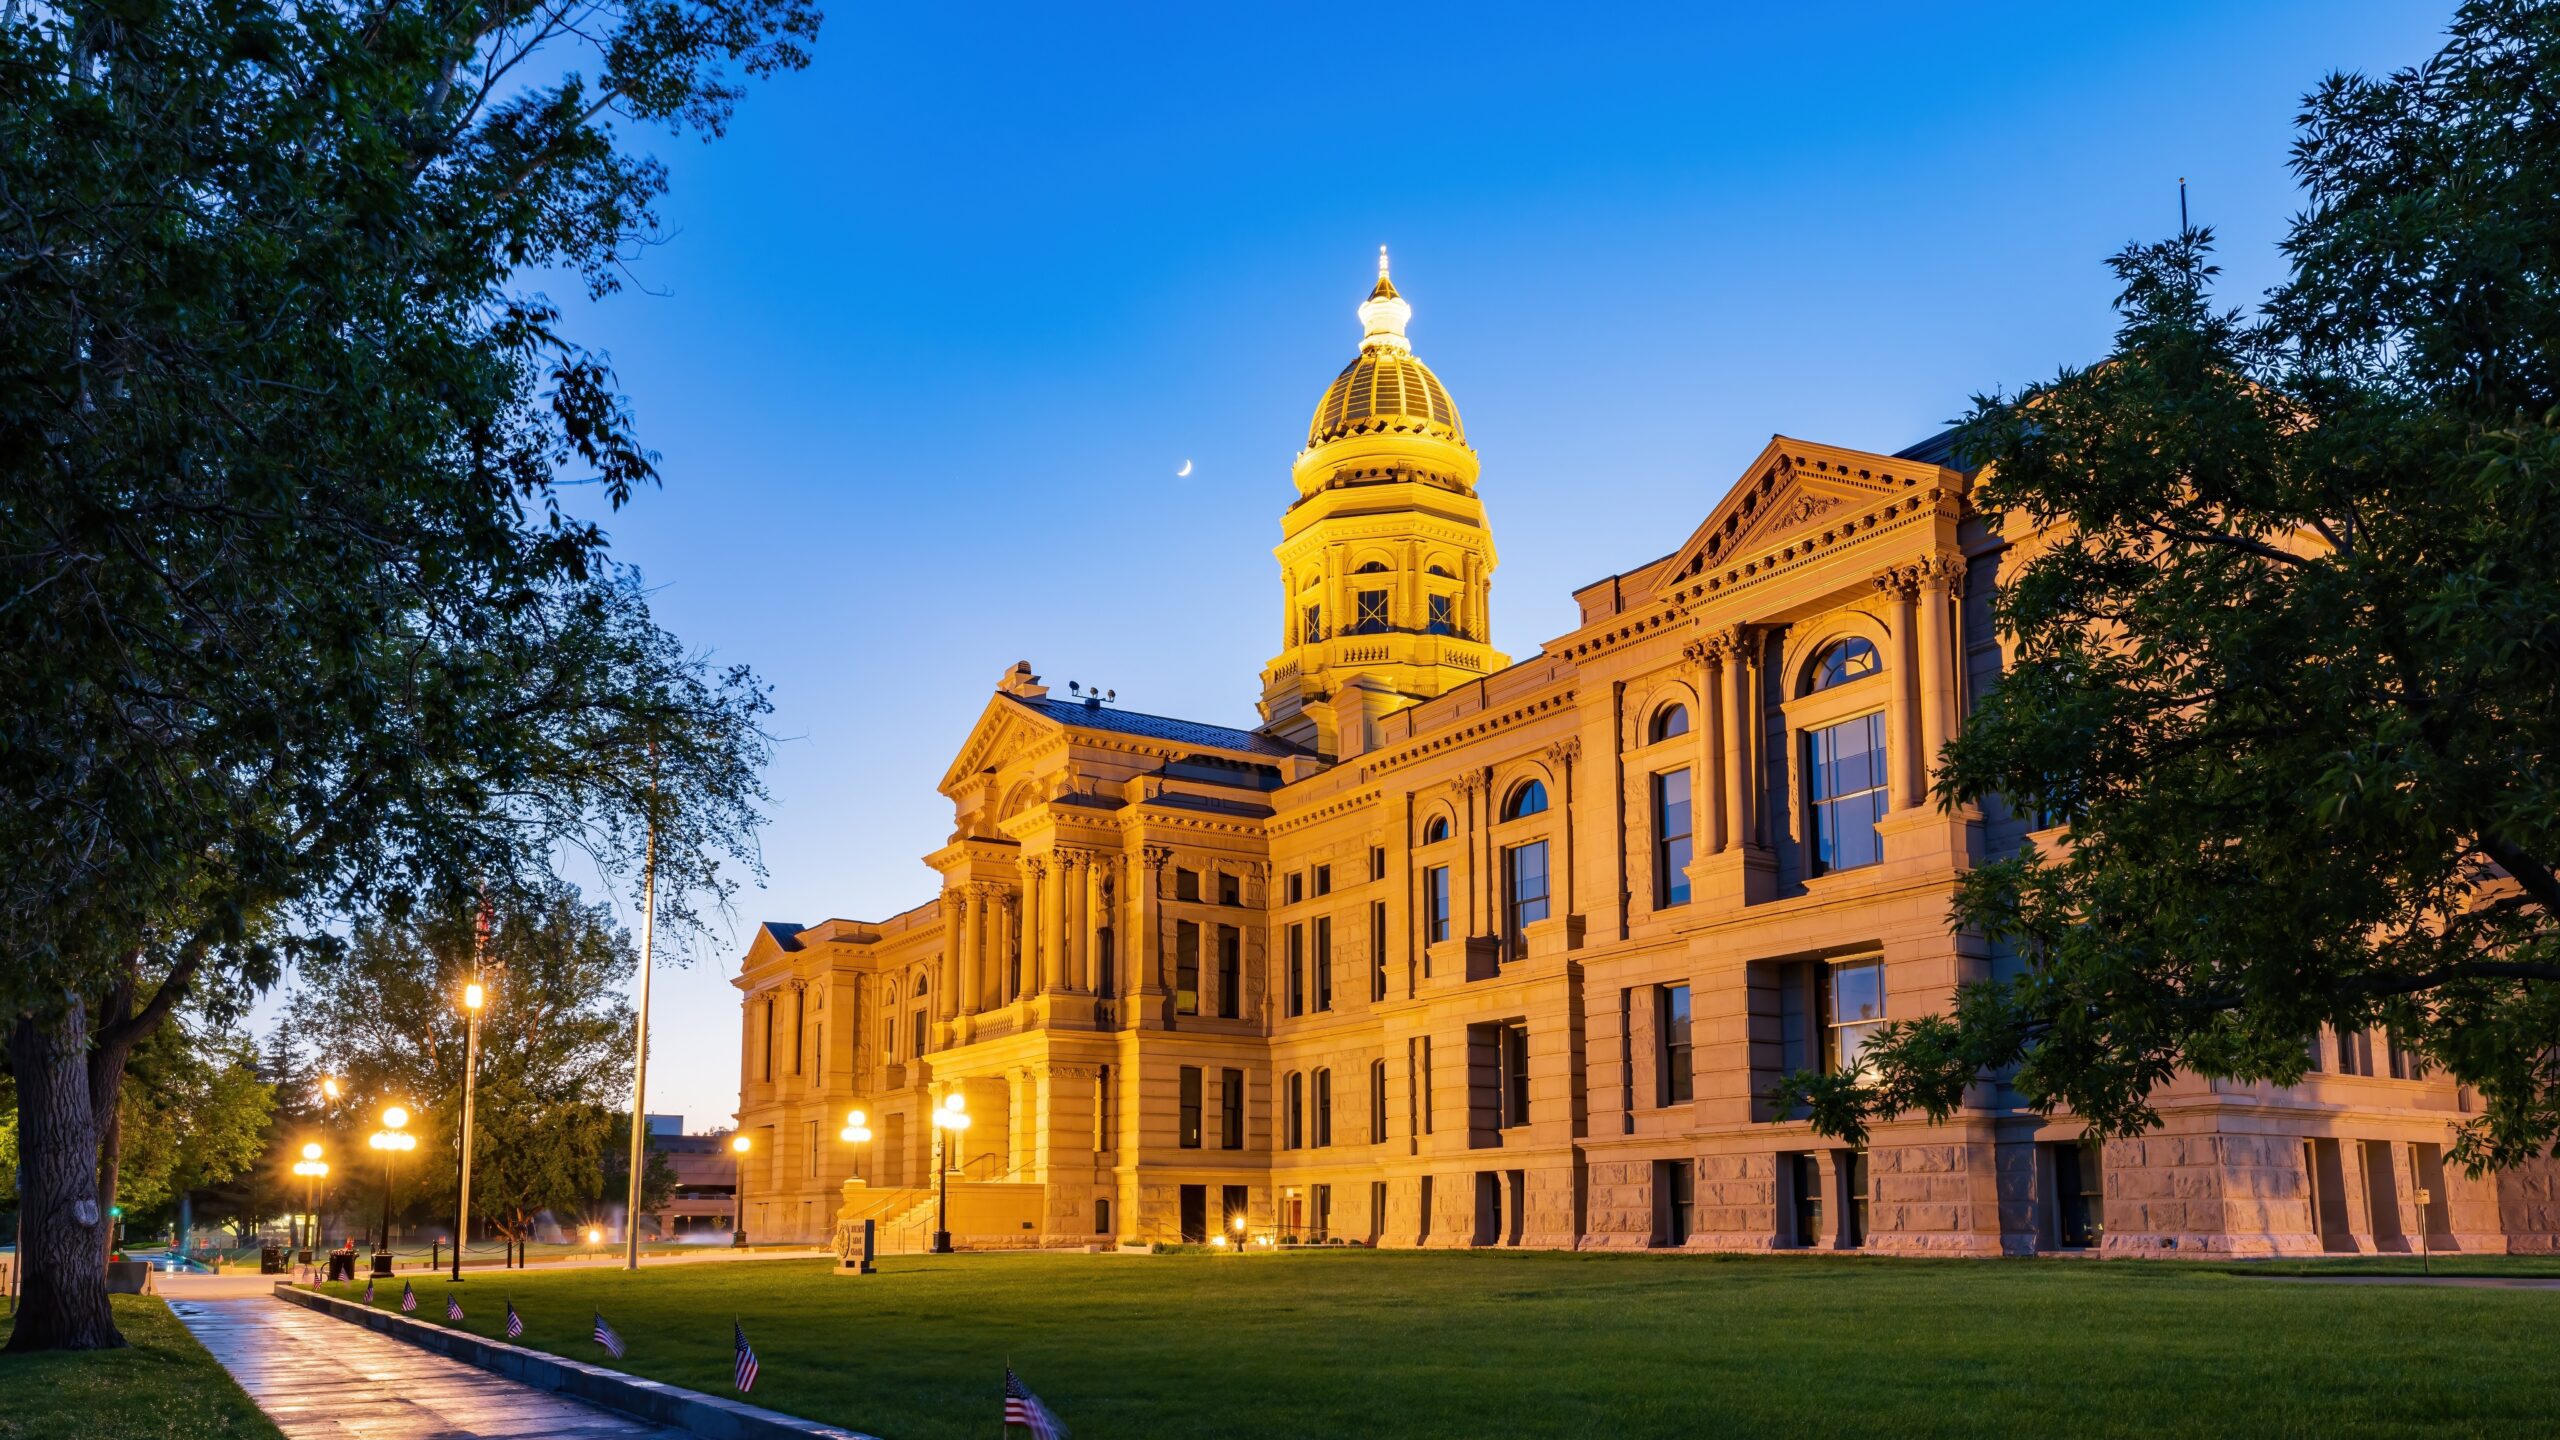
Overall Score: 15.4
There aren’t that many people living in Wyoming right now, but there are job openings for people who want to change that. The Equality State has seen the biggest growth in recent hiring, with a 2.6% growth in nonfarm employment (5th). It also has a relatively high rate of job openings at 6.4% (12th). Mining and supporting services are a core part of Wyoming’s industrial mix. Compensation is slightly national median, but the state’s generally low cost of living should offset that.
6. Georgia

Overall Score: 15.7
Georgia finishes just slightly above the median in most of our metrics save one very important one: it’s ranked 7th for its job opening rate of 6.7%. Manufacturing, transportation (Hartfield-Jackson Atlanta International Airport is the busiest in the U.S.), and agribusiness form important sectors in the Peach State. There has also been notable recent growth in health care, finance, and insurance.
7. Colorado

Overall Score: 16.5
The Centennial State boasts one of the best employment rates in the nation right now at 65.6% (5th). Those workers tend to also enjoy strong salaries (8th) and household income (8th), with notable industry clusters in mining, research, and advanced manufacturing. The one stain on Colorado’s sheet is its recent slump in employment growth over the past year, which was among the lowest of all states at 1.1% (40th). With a fairly strong job opening rate of 6.3% (14th), this may only be a temporary bump in the road.
8. Delaware
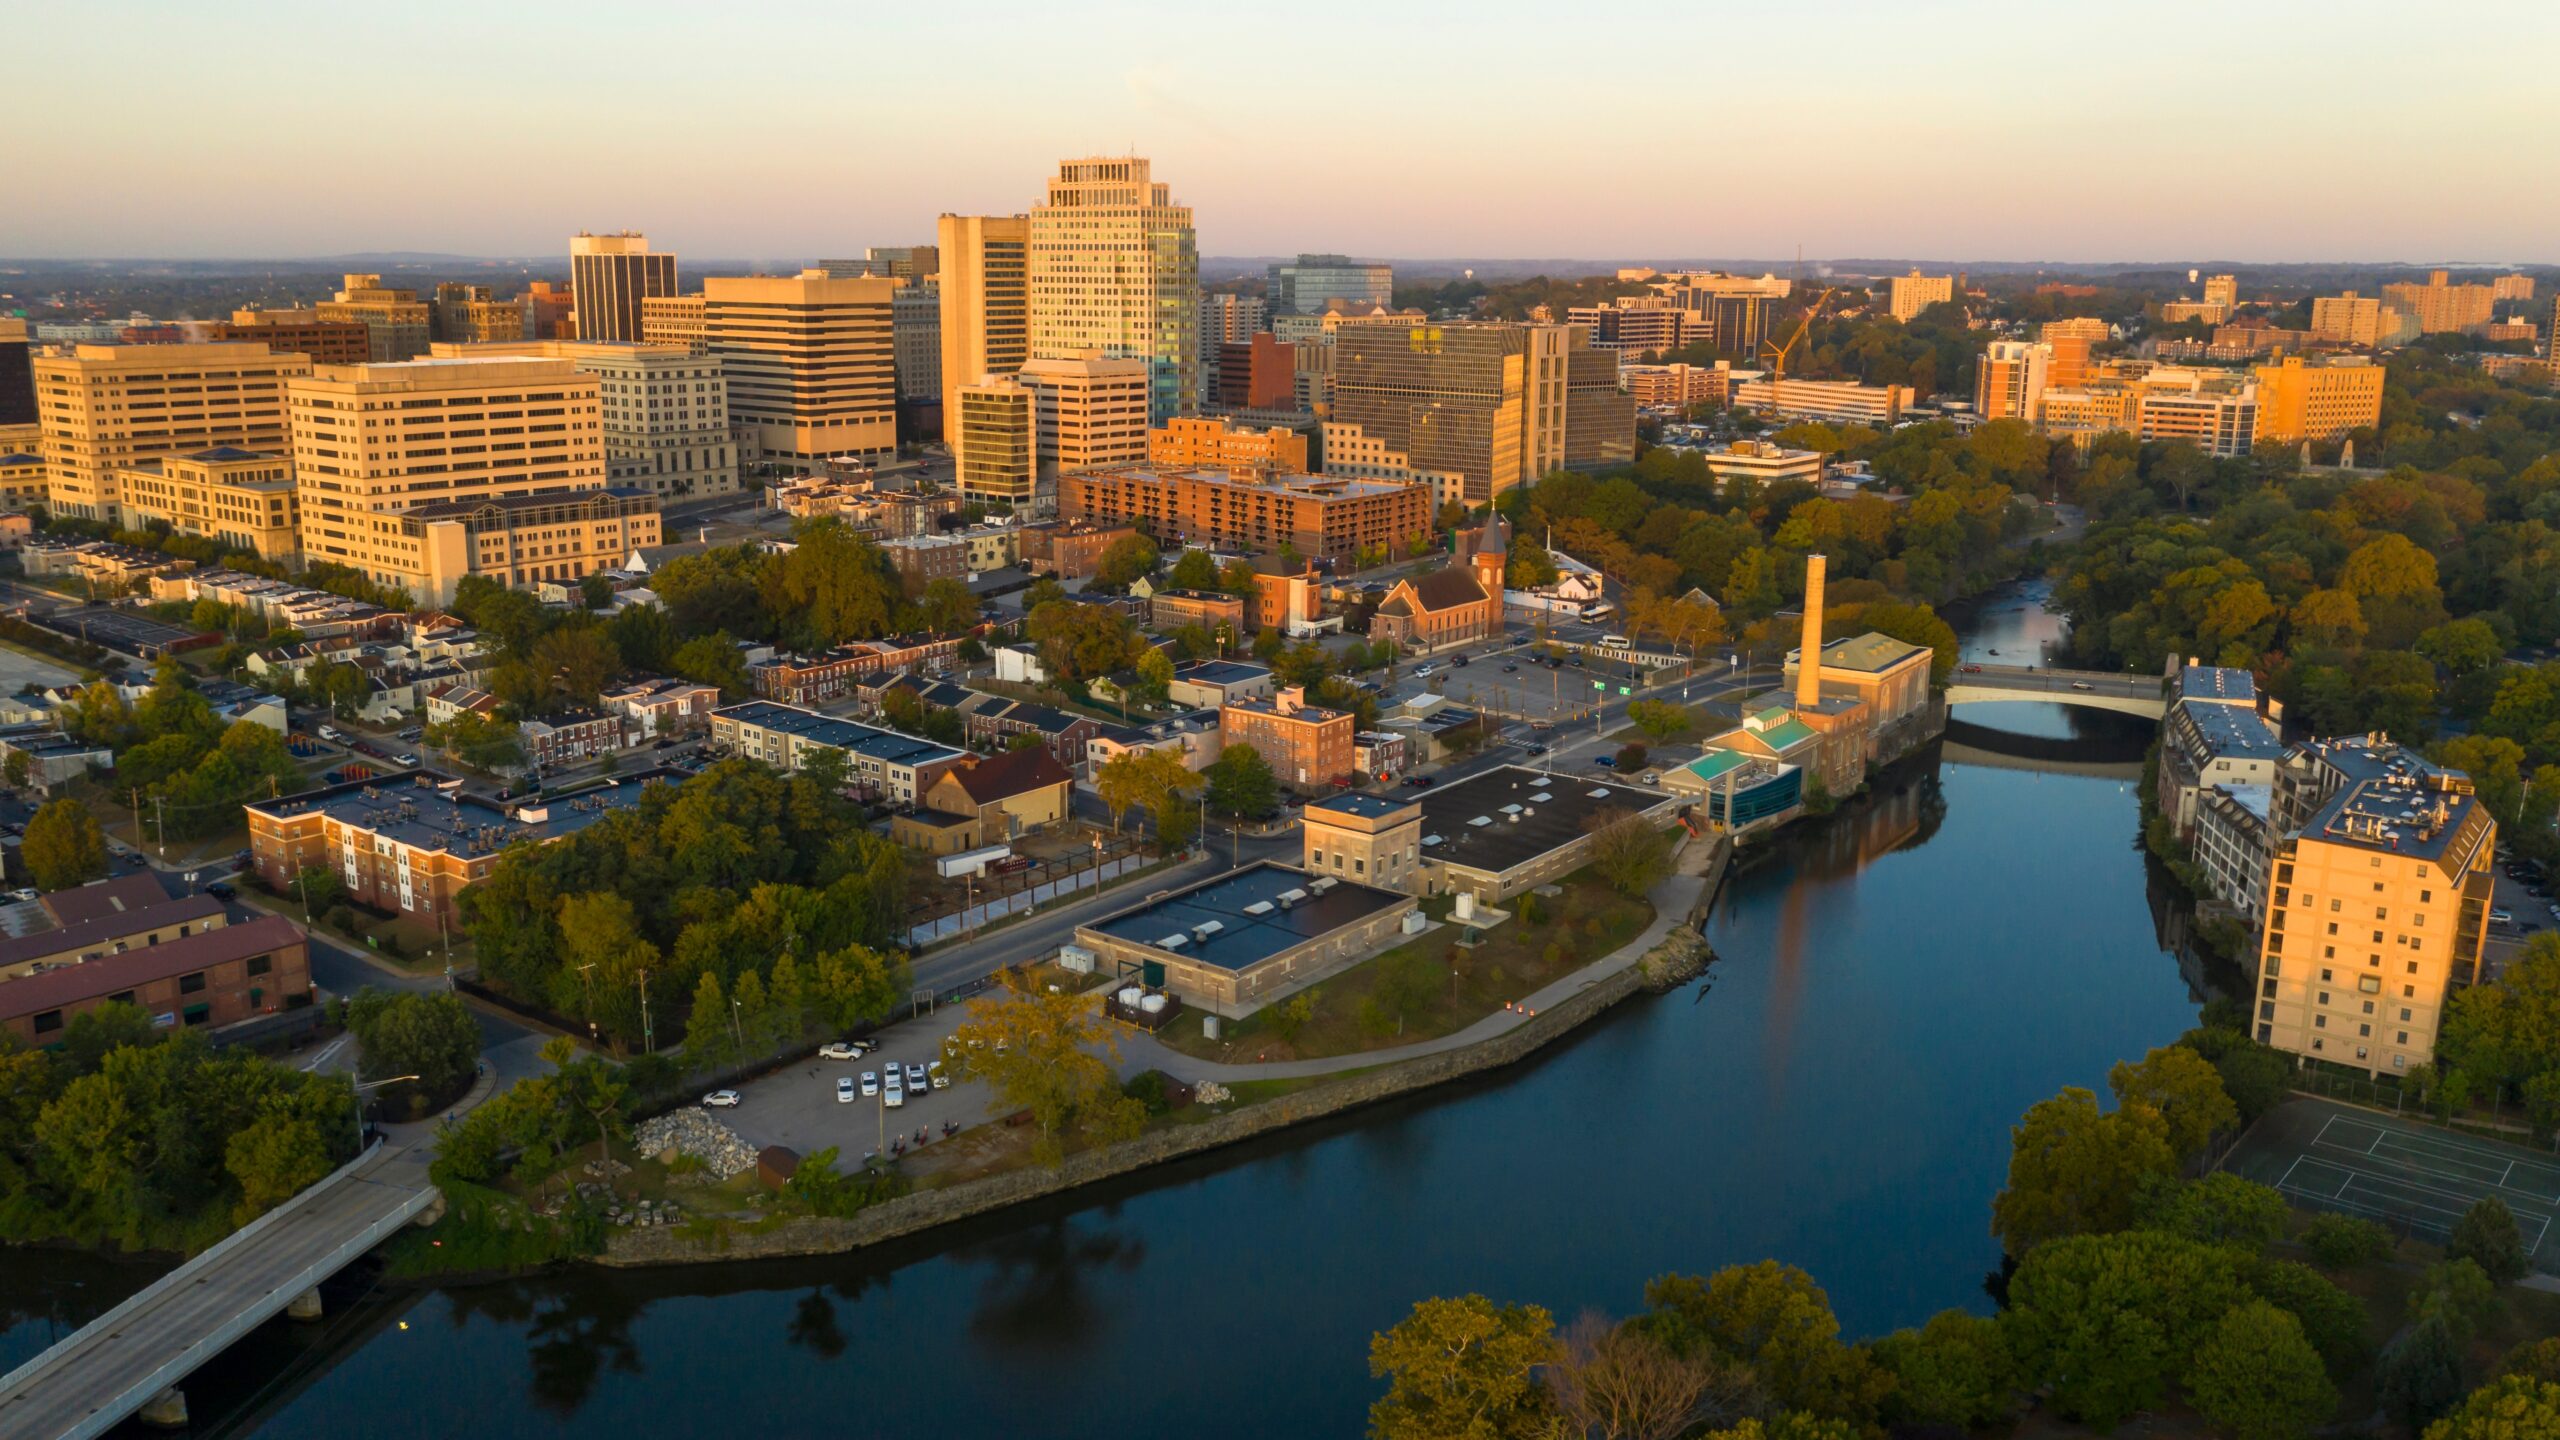
Overall Score: 16.7
Known for its financial services industry, particularly credit card issuing, Delaware offers relatively strong wages (16th) and household income (14th). Its current employment rate ranks in the bottom third of the nation at 59.7% (33rd), but that looks to be changing. The Diamond State saw good employment growth over the past year (14th) and has a healthy job opening rate (15th).
9. Massachusetts

Overall Score: 18.1
Massachusetts remains one of the wealthiest states in the nation for the employed (8th), with the highest average wage of $76,600 (1st) and very strong household income (3rd) thanks to industries like finance, education, manufacturing, and insurance. Employment growth was strong in the Bay State last year as well, growing 2.1% (12th). So, what’s keeping Massachusetts from climbing up the ranks? A job opening rate of 5.7% (36th) may mean relatively fewer opportunities for the average worker.
10. Utah
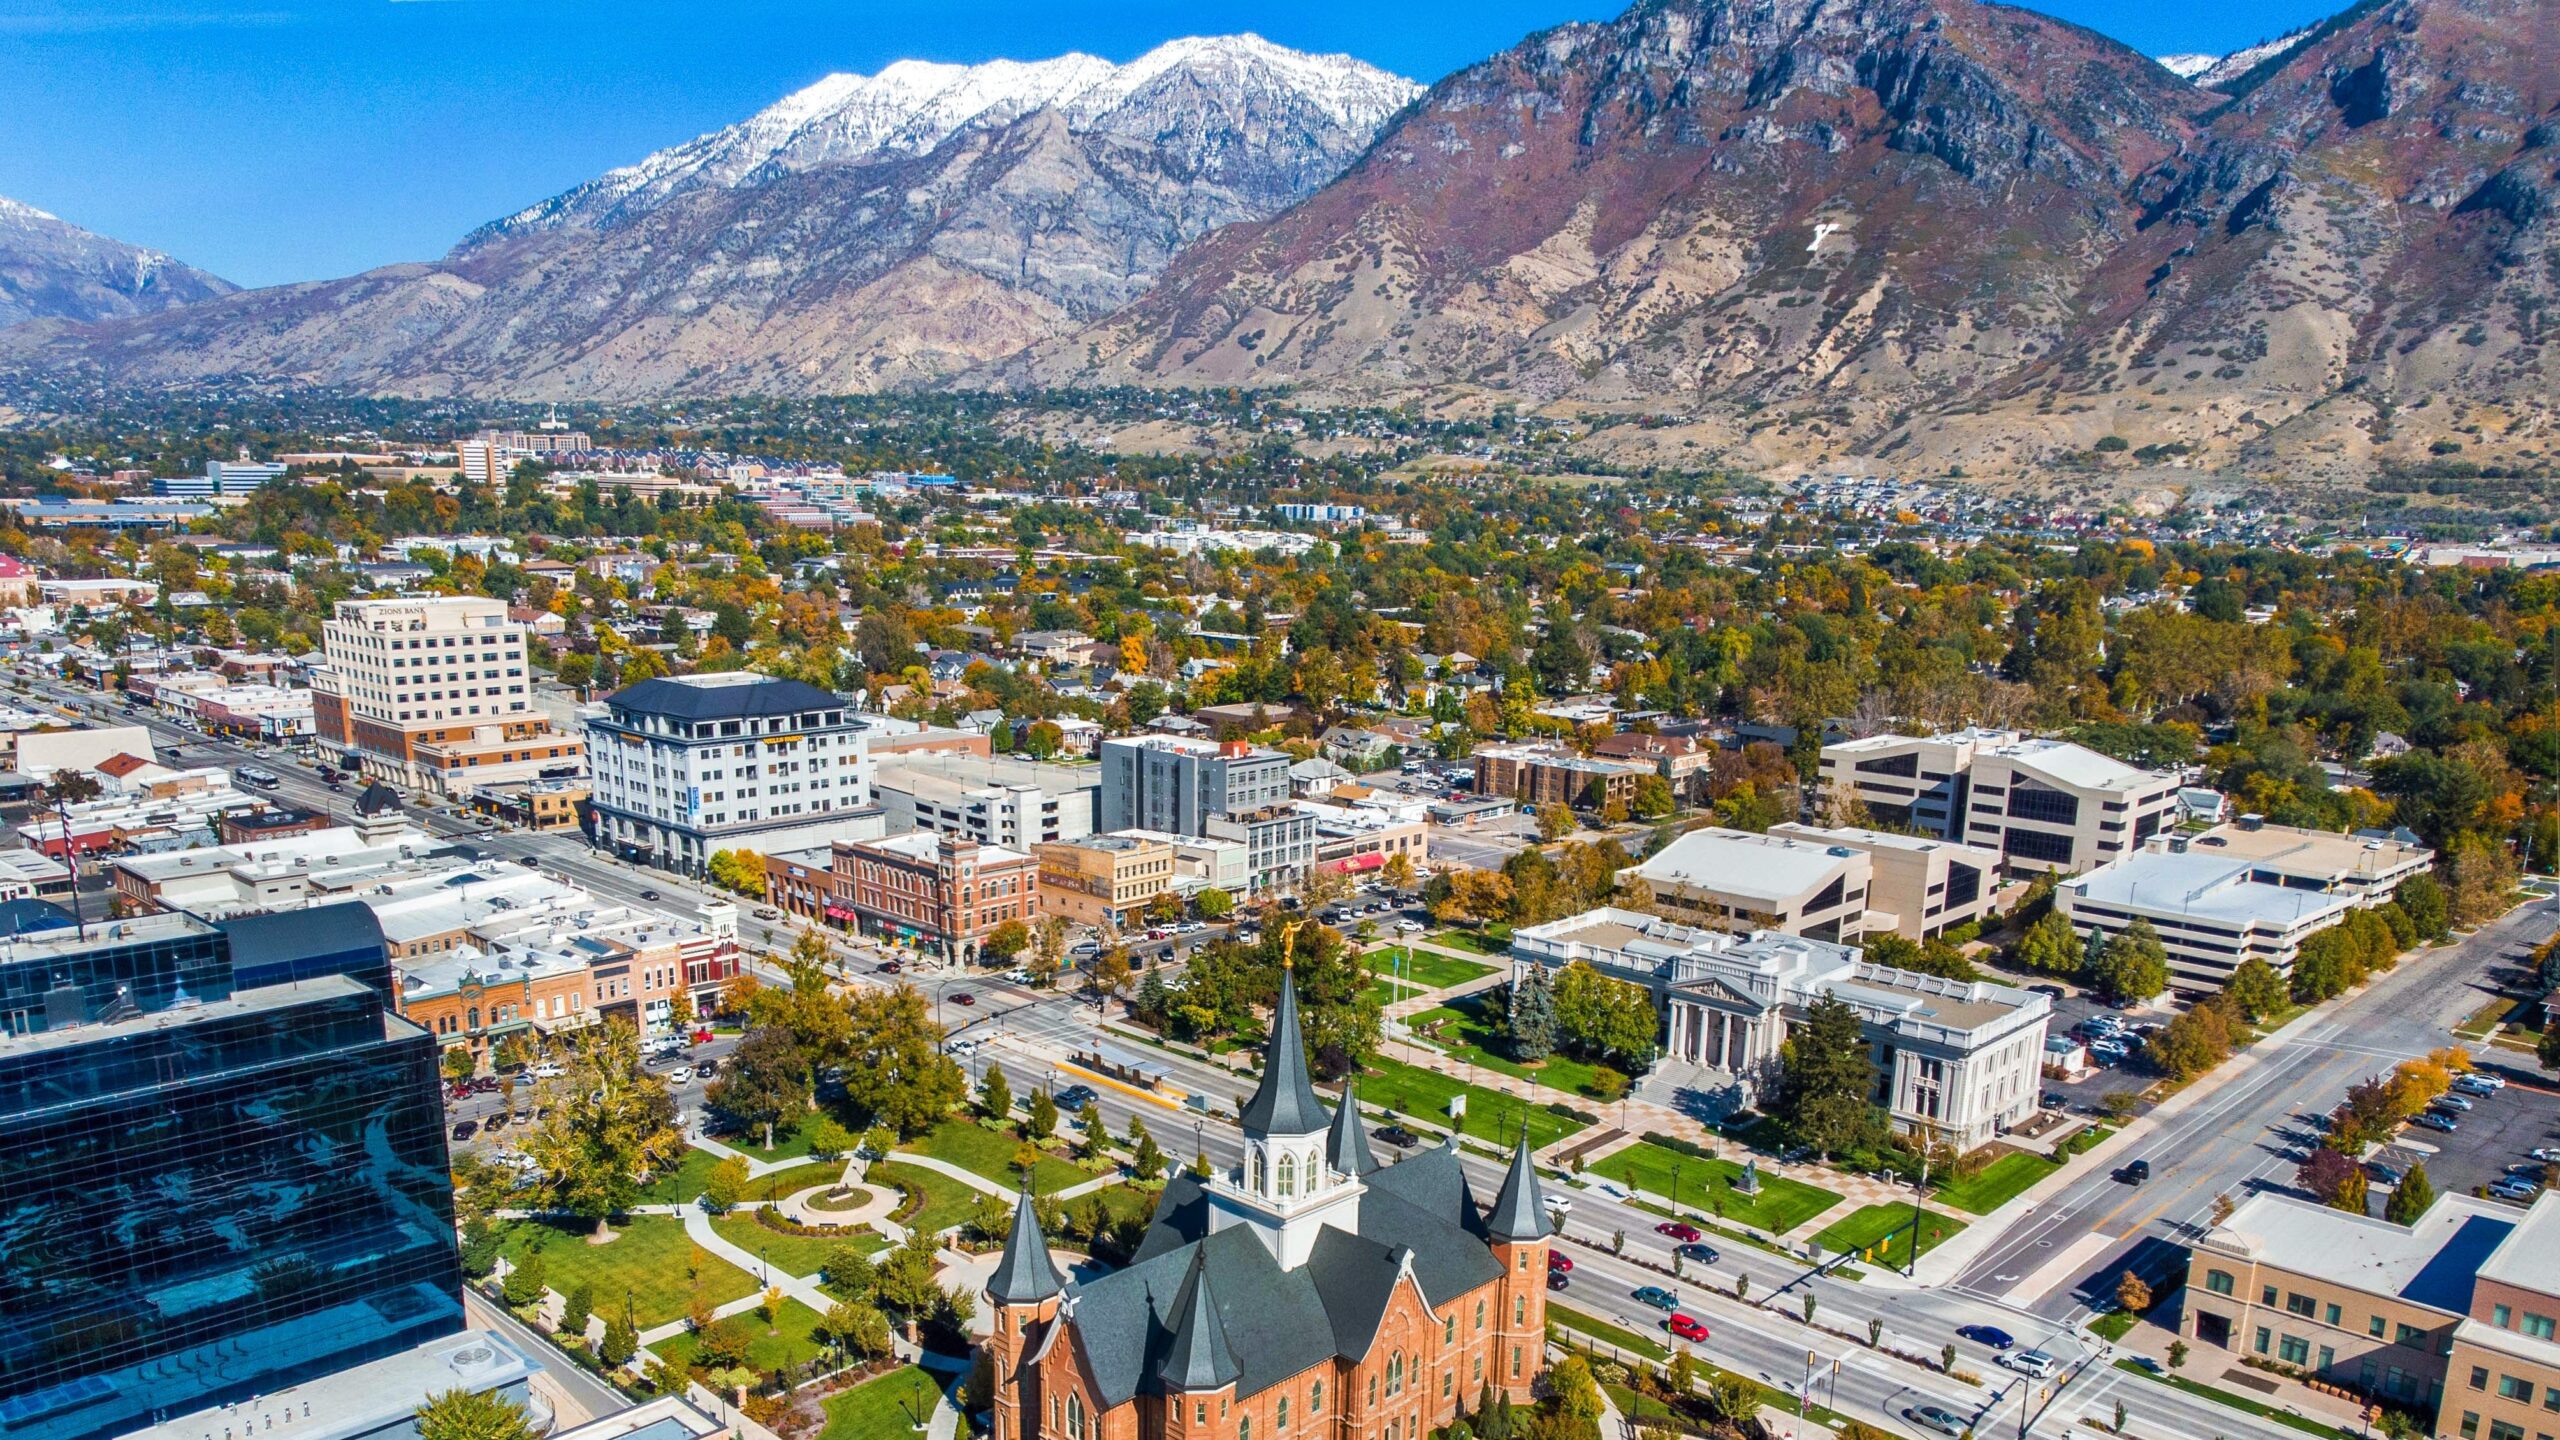
Overall Score: 20.6
Utah has recently developed a reputation for unstoppable growth, so it’s little surprise to see it among the top 10. The Beehive State employs more of its citizens than any other state at 67.8% (1st), with strong household income (9th) thanks to industries liking mining, manufacturing, and increasingly finance. Employment growth over the last year was strong at 2.3% (7th), but there may be some drag starting to develop on the Salt Lake City economic super highway. Utah’s job opening rate is among the weaker in the nation at 5.8% (34th).
10 WORST STATES FOR JOB GROWTH 2024
41. New York
(Score: 32.7 out of 50)
The Empire State is still limping into the remote work era. While it still has some of the highest mean wages (2nd), its job opening rate of 4.6% (49th) has been lagging behind every state but Washington.
42. Mississippi
Overall Score: 32.9
Much has been written about Mississippi’s poverty (50th in mean wages and household income), but perhaps more concerning is that employment didn’t grow at all over the past year (49th). That may change soon, however, given the state’s high job opening rate of 6.6% (8th).
43. Alabama
Overall Score: 34.4
Mississippi’s neighbor is a little stronger in wages (46th) and household income (44th) and saw some employment growth (39th). It’s job opening rate, while not terrible at 6.2% (21st) is just above the median.
44. Missouri
Overall Score: 34.9
With all of its metrics below the median, Missouri finds itself lagging behind most of the country in job prospects. With a job opening rate of just 5.7% (37th), that looks unlikely to change in the near future for the Show-Me State.
45. Hawaii
Overall Score: 35.7
Employment growth has been tepid in the Aloha State (1.1%, 45th), with relatively little change on the horizon (4.8% job opening rate, 47th). Household income is among the highest in the nation (4th), though somewhat offset by a high cost of living.
46. Arkansas
Overall Score: 37.4
Arkansas’s employment growth couldn’t break 1% over the last year (47th). The job opening rate isn’t bad (22nd), but with the second lowest average wage (49th) in the nation, they may not be very lucrative.
47. Kansas
Overall Score: 37.5
Kansas employs a relatively high percentage of its population (15th), but that number didn’t grow much over the past year (43rd). A low job opening rate of 5.5% (41st) suggests this slow growth will likely continue.
48. Michigan
Overall Score: 37.9
The median wage in Michigan isn’t bad at $58,000 (22nd), but with employment growth below 1% (46th), a relatively low employment rate (38th), and a comparatively sluggish job growth rate of 5.2% (42nd), it doesn’t look like the Great Lakes State will be setting any records.
49. Iowa
Overall Score: 38.1
Iowa has one of the best employment rates in the country at 64.5% (6th), but that number barely grew last year at 0.2% (48th). With a job opening rate of 5.1% (44th), this may not change anytime soon.
50. Indiana
Overall Score: 40.3
A low rate of job openings (5%, 46th) and a relatively small increase in employment last year (1.1%, 44th) combined with low wages (37th) and household income (38th) make Indiana the worst prospect for job growth in the coming year.
COMPLETE RANKING OF ALL 50 STATES
Methodology
To create our rankings, we selected five metrics to evaluate a state’s outlook for job growth. Within each metric, the state was given a rank. Each metric was multiplied by a selected weight and then aggregated to create an overall score of 1 to 50, with the best-performing states having a lower score.
The five metrics we chose were:
- Change Nonfarm Employment (20%): This metric represents the change in total nonfarm employment between Sept. 2022 and Sept. 2023. Data was sourced from the U.S. Bureau of Labor Statistics.
- State Job Opening Rate (40%): This metric represents the number of job openings in Sept. 2023 divided by the sum of all filled and unfilled jobs, multiplied by 100. Data was sourced from the U.S. Bureau of Labor Statistics.
- Employment Rate (10%): This metric represents the number of employed by the civilian noninstitutional population, multiplied by 100. Data was sourced from the US Census.
- Annual Mean Salary (20%): This metric represents the average wage within the state. Data is from May 2022, the most recent available from the U.S. Bureau of Labor Statistics
- Median Household Income (10%): This metric represents the income level at which half of all households earn more and half earn less than the given value. Data is sourced from the U.S. Census.