

Table of contents
Big states like California, New York, and Florida may command a significant portion of the financial industry, but a surprising number of smaller states are giving them a run for their money – or even beating them – when it comes to small business lending.
Small businesses account for over 46% of all private sector employment in the U.S., according to the Small Business Administration (SBA). However, many struggle to get access to the capital they need to grow, expand, or get through temporary hardships. But do small businesses in some states have an easier time getting a loan?
Owners who are into skiing and terminal lakes are in luck because Utah tops our list as the best state for small business loans. NationalBusinessCapital.com’s inaugural report, “The Best and Worst States to Get a Small Business Loan,” found Utah, along with Minnesota and Wisconsin, were most effective at supporting their small business communities with business loans.
Our top 10 list reflects the SBA’s versatile approach to aiding small businesses. Both large and small states with very different political climates and, frequently, very different approaches to cultivating and sustaining their small business sectors – are represented. Some of these states efficiently distributed working capital, while others were more effective at helping their small businesses acquire and develop property. Other states put more resources into helping new or underserved businesses get off the ground with microloans.
Our Top 10 list showcases an array of high performers, highlighting at least one strong contender from every significant geographical region of the continental U.S.
Key Findings
- States Don’t Have to Be Big to Have Robust Small Business Lending Climates: Traditional financial powerhouses like New York and California performed well as one might expect but were overshadowed by states like Utah and its thriving FinTech sector and the efficient small business lending infrastructures of Minnesota and Wisconsin.
- California Accounted for Nearly 1-in-4 SBA 504 Program Dollars Lent in 2022: While California lenders didn’t originate a particularly high volume of loans in 2022, small businesses within that state received 24.3% of all SBA 504 dollars allocated – a percentage that far exceeds its share of the population. 504 loans are primarily used to purchase assets like real estate and heavy equipment.
- The South’s Small Business Lending Environment Lagged Behind Other Regions: Southern states are often considered to have a regulatory environment favorable to small businesses, but capital may not be as easy to access in the region. Southern states generally lagged behind other regions in approvals and disbursements, Florida being a notable exception, with Georgia and Texas following behind at a distance.
- Political Alignment Didn’t Strongly Correlate to Rankings: While blue states did slightly better at the extremes, our top state was the strongly Republican Utah, which was joined by high-performers Florida and Idaho. This suggests that support for, or neglect of, small business financing is an issue that transcends political affiliation.
Top 10 States to Get a Business Loan in 2023
1. Utah

Score (out of 100): 78.4
Utah is the fastest growing state in the nation, with Salt Lake City emerging as a FinTech powerhouse. That growth is translating to small business lending as well.
The Beehive State has recently seen a frenzy of both 7(a) (4th) and 504 approvals (2nd), capturing 4% of all 504 loan dollars allocated in 2022 (6th), an impressive feat for a state with a relatively small population. With only one microloan intermediary (41st, tied) serving the state, however, the competition for loan dollars for less established companies may be high.
2. Minnesota

Overall Score: 78
Access is the name of the game in the North Star State, which excels in volume of both 7(a) (4th) and 504 (6th) loan approvals. Microloan opportunities abound as well, with the state punching well above its population weight with 10 intermediaries (4th).
Overall, Minnesota captured more than a fair share of 7(a) (10th) and 504 (7th) dollars. Average loan sizes were on the small side, however, ranking 31st and 28th, respectively.
3. Wisconsin
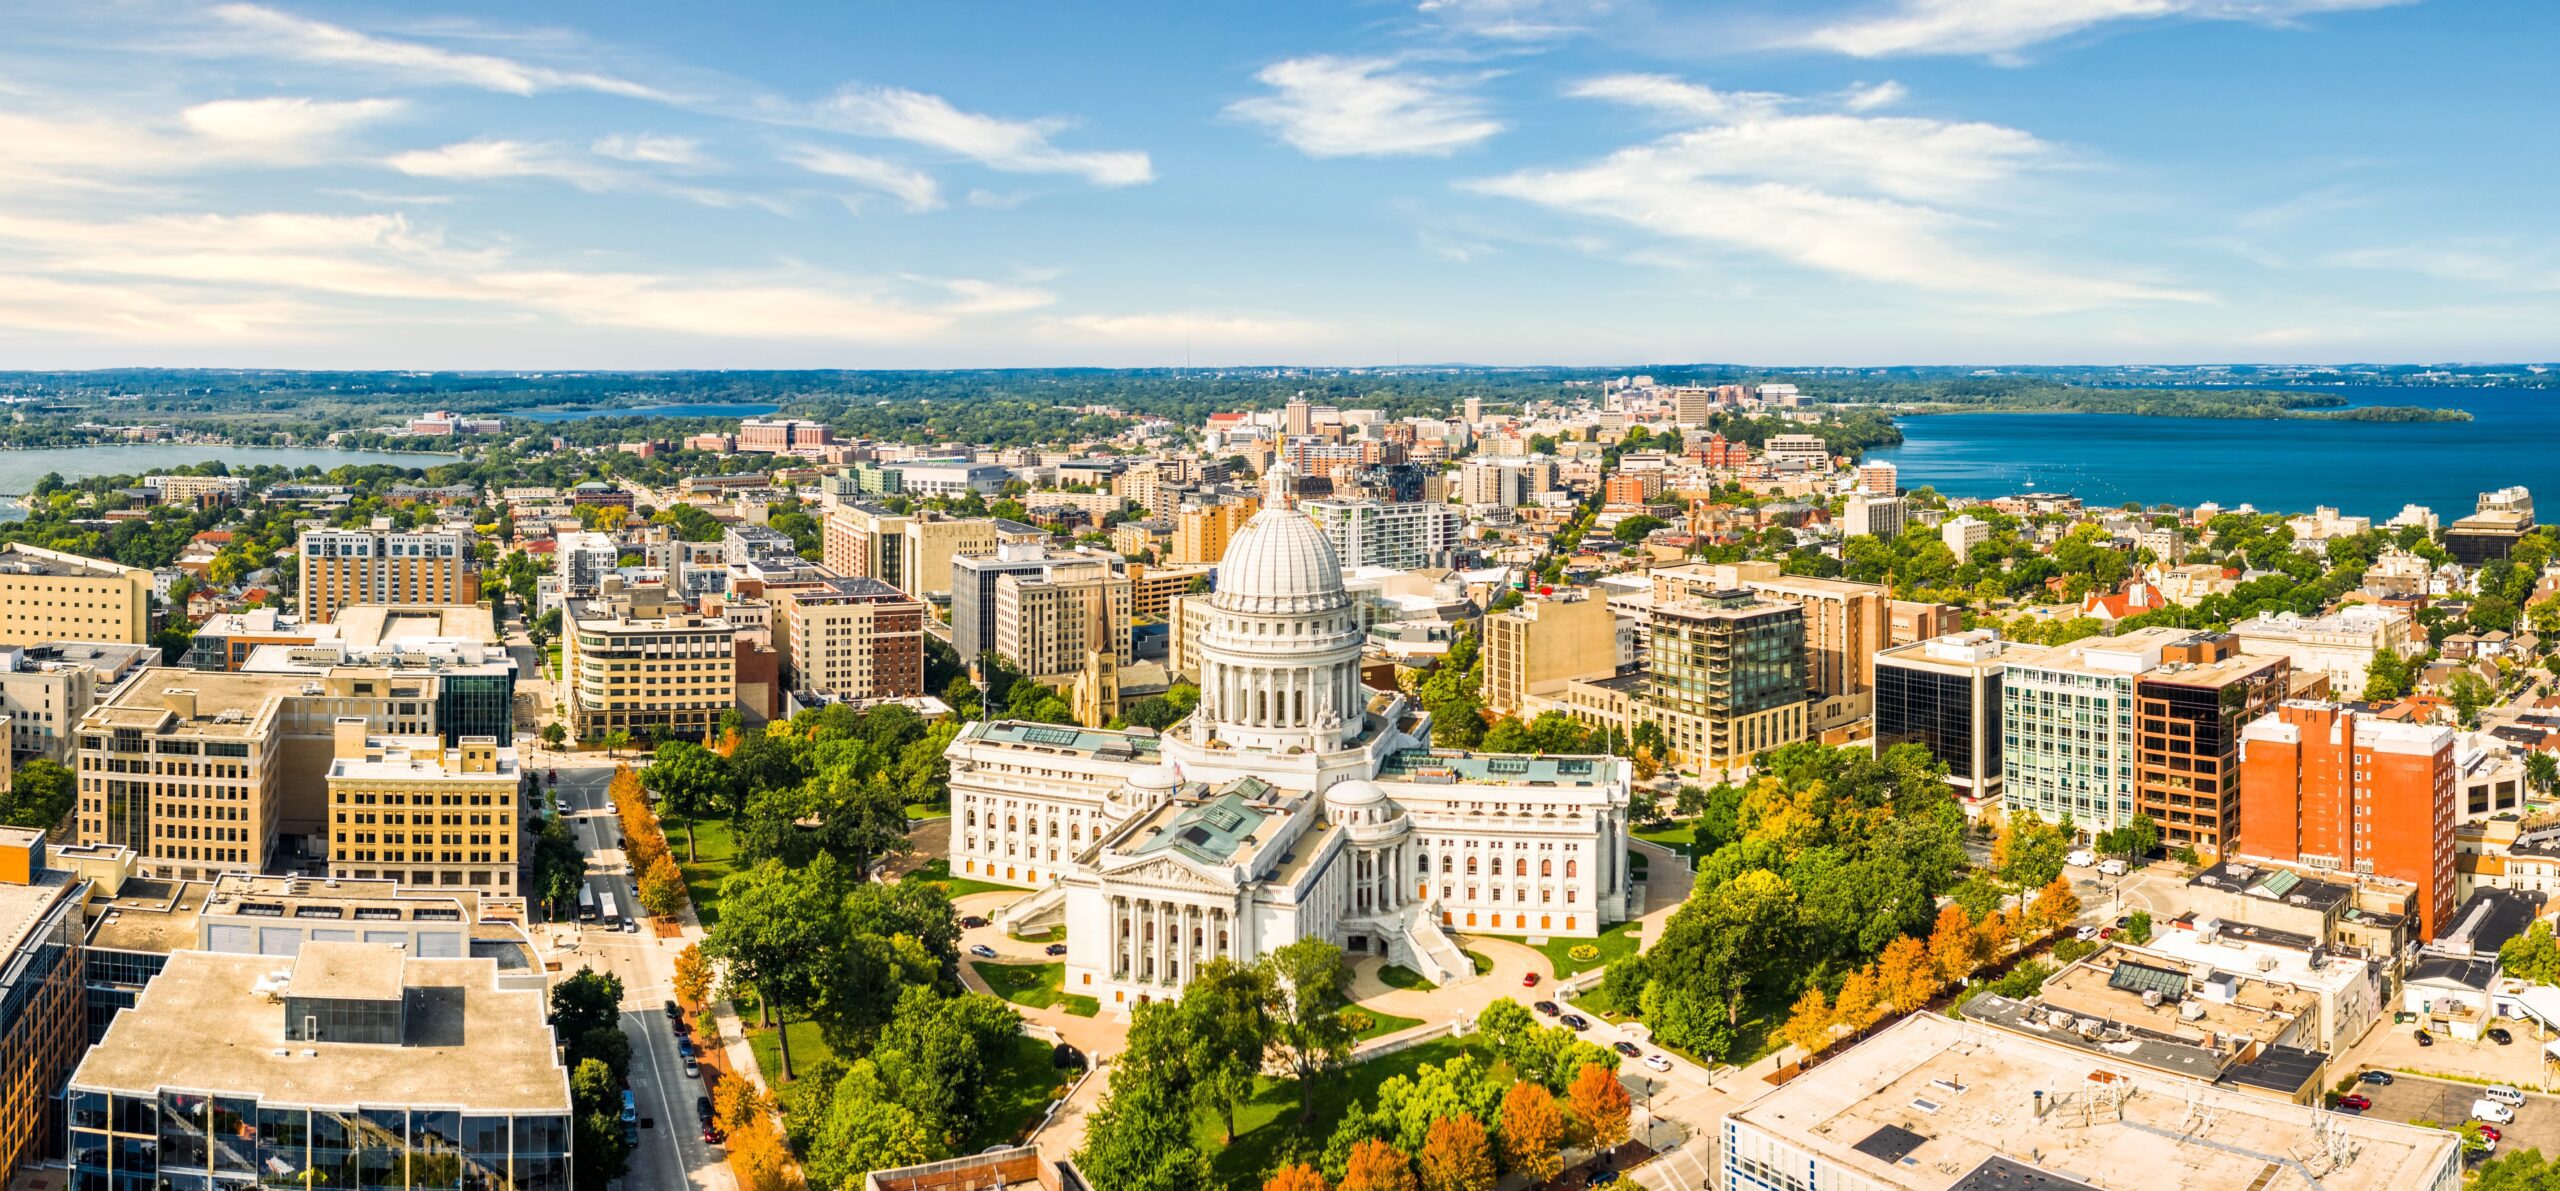
Overall Score: 76
Breathing down Minnesota’s neck is its eastern neighbor, Wisconsin. While the Badger State has lower rates of approval for 7(a) (15th) and 504 (9th) loans, the average size of 7(a) loans (3rd) disbursed in Wisconsin was over five times larger.
Wisconsin borrowers didn’t have quite as voracious an appetite for 504 loans as they did for working capital, however. These were of a much more modest size on average (29th).
4. California

Overall Score: 74
Being the largest state in the country by population has its privileges, and that includes netting the highest share of SBA-guaranteed funds. Accounting for roughly 12% of the population, California managed to secure 10.3% of 7(a) funds (1st) and a whopping 24.3% of all 504 funds (1st), which are generally used for asset acquisitions. These 504 disbursals were both large on average (4th) and fairly widely distributed in terms of number of approvals (14th).
Business owners seeking microloans in the Golden State have a variety of options to choose from (1st) as well.
4. Colorado

Overall Score: 74
Tied with California for 4th place is the Centennial State. While Colorado didn’t dominate in any particular metric, it also didn’t have any serious weaknesses. At less than 2% of the nation’s population, it captured 2.4% of all 7(a) (13th) and 504 (12th) dollars in 2022.
Entrepreneurs in Colorado enjoy high approval rates for 7(a) loans (8th) and respectable ones for 504 loans (17th), which average loan disbursals above the national median, 16th and 20th, respectively.
6. New York

Overall Score: 71.4
Despite its recent well-publicized population losses, the Empire State is still a powerhouse when it comes to finance. In fact, New York businesses that successfully applied for 7(a) working capital saw an average loan size of over $4 million (1st), accounting for 5.7% of all 7(a) funds (5th), just a hair below New York’s share of the national population. 504 average loan sizes were also quite large (8th) and accounted for 4.3% of all 504 funds (5th).
On the other hand, getting approved in New York can be challenging, with 7(a) (26th) and 504 (31st) approvals falling below the national median. Microloan applicants will have 14 intermediaries (2nd) to choose from, however.
7. Massachusetts

Overall Score: 69.9
The Bay State makes a respectable showing at No. 7, thanks in large part to the percentage of 7(a) (13th) and 504 dollars (11th) it was able to capture in 2022, both of which exceeded its share of the national population. Approval rates were likewise above average, with Massachusetts ranking 16th for 7(a) loans and 12th for 504 loans.
Despite this, the average 504 loan size (44th) for Massachusetts firms was quite small, which could be a problem in a state with expensive real estate. Average working capital (7(a)) disbursements (11th) were much higher, however.
8. New Jersey

Overall Score: 69.8
Coming in just a nose behind Massachusetts is the Garden State, where the competition for scarce 504 dollars is fierce but profitable to those who are approved. New Jersey lenders approved just 1.46 504 applications per 100,000 residents (38th), but the average loan amount exceeded $1.3 million (3rd).
It’s much less of a rat race on the working capital side. New Jersey captures more than its fair share of 7(a) dollars (9th) and has both high rates of approval (14th) and high average loan amounts (8th).
9. Florida

Overall Score: 68.2
The Sunshine State has been in a building frenzy, a trait reflected in its capture of 8% of all 504 funds, second only to California. Florida also managed to score its fair share of 6.8% of all 7(a) funds (4th).
Things aren’t quite as sunny when it comes to access, however. Florida squeaks in just above the median in approval rates for 7(a) (23rd) and 504 (20th). It also has only three microloan intermediaries (25th), a very low number for the third most populous state.
10. Idaho
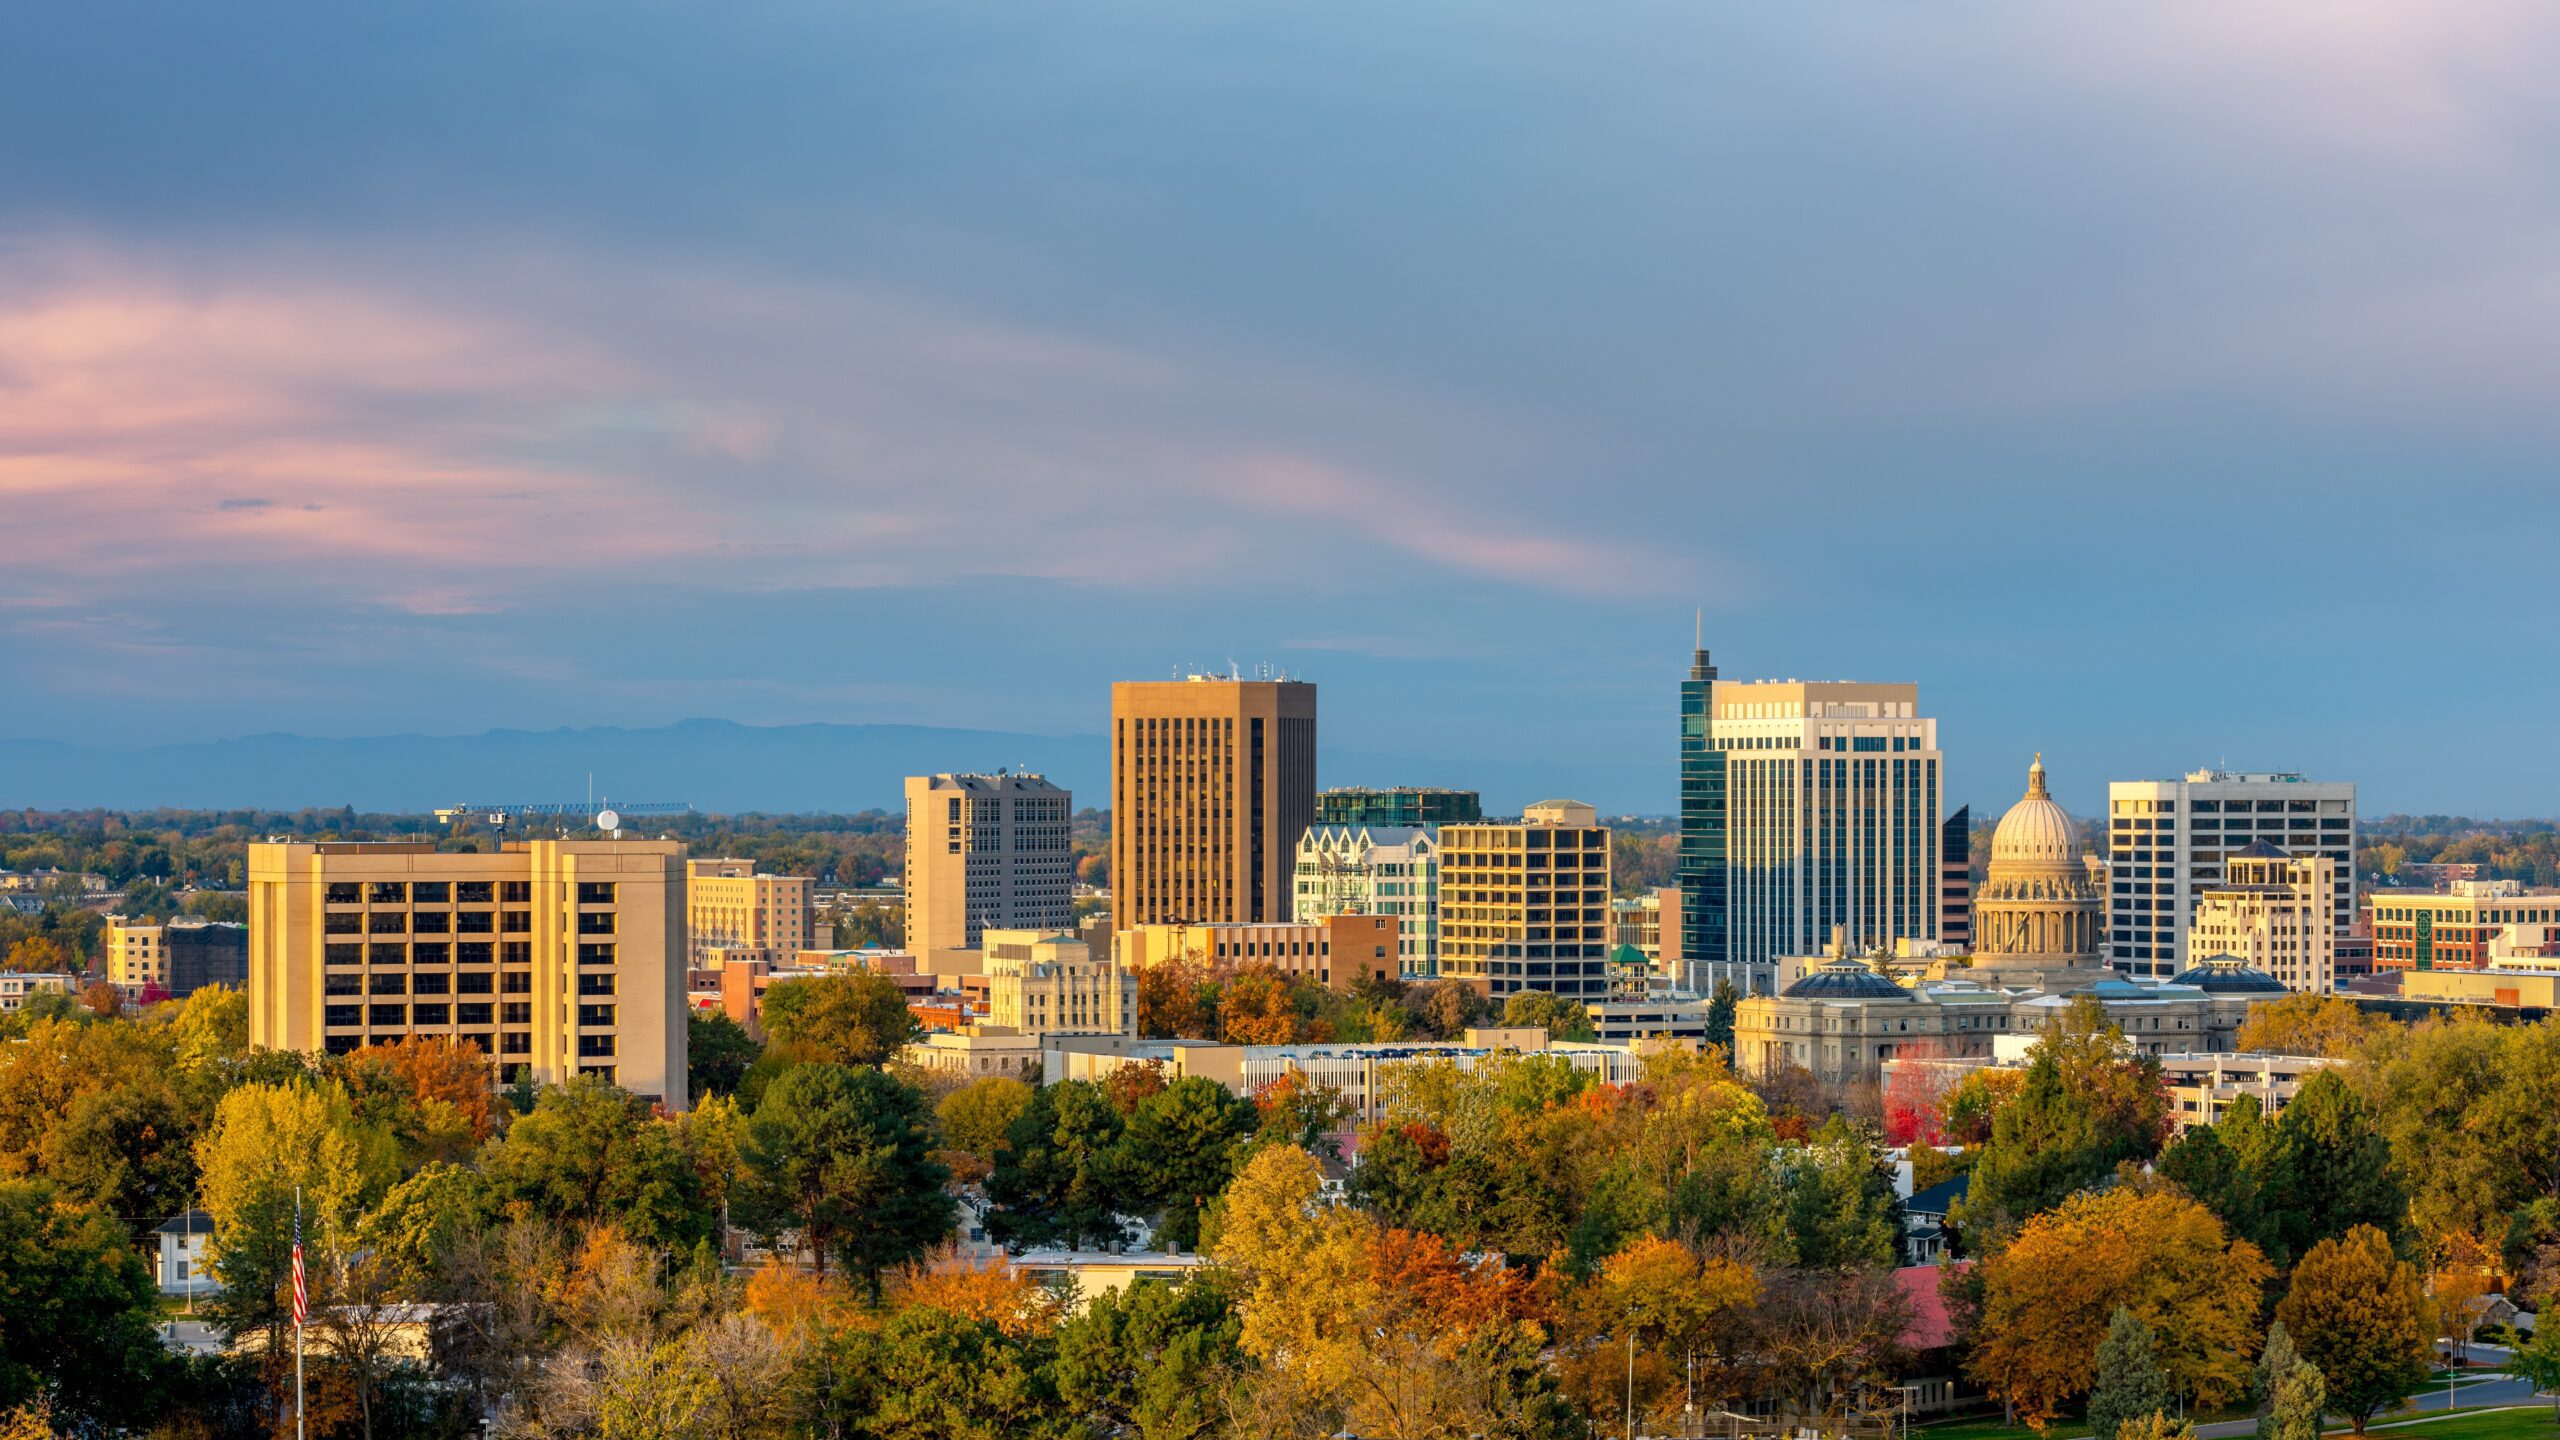
Overall Score: 68
Bringing up the rear is Idaho, a state that saw a substantial boom during the pandemic. Businesses in the Gem State enjoyed high approval rates for both 7(a) (5th) and 504 (8th) loans, with average loan amounts slightly above the median (5th for both). Idaho also managed to capture a high percentage of 504 dollars (24th), given its ranking as the 37th most populous state.
Borrowers seeking microloans only have two options for intermediaries (35th), but that may not be a major issue in a state as small as Idaho.
Bottom 10 States to Get a Business Loan in 2023
41. Tennessee
(Score: 34.9 out of 100)
The few borrowers who managed to score a 504 loan (49th) in Tennessee receive large lump sums(1st), but funding may prove elusive for many Volunteer State businesses.
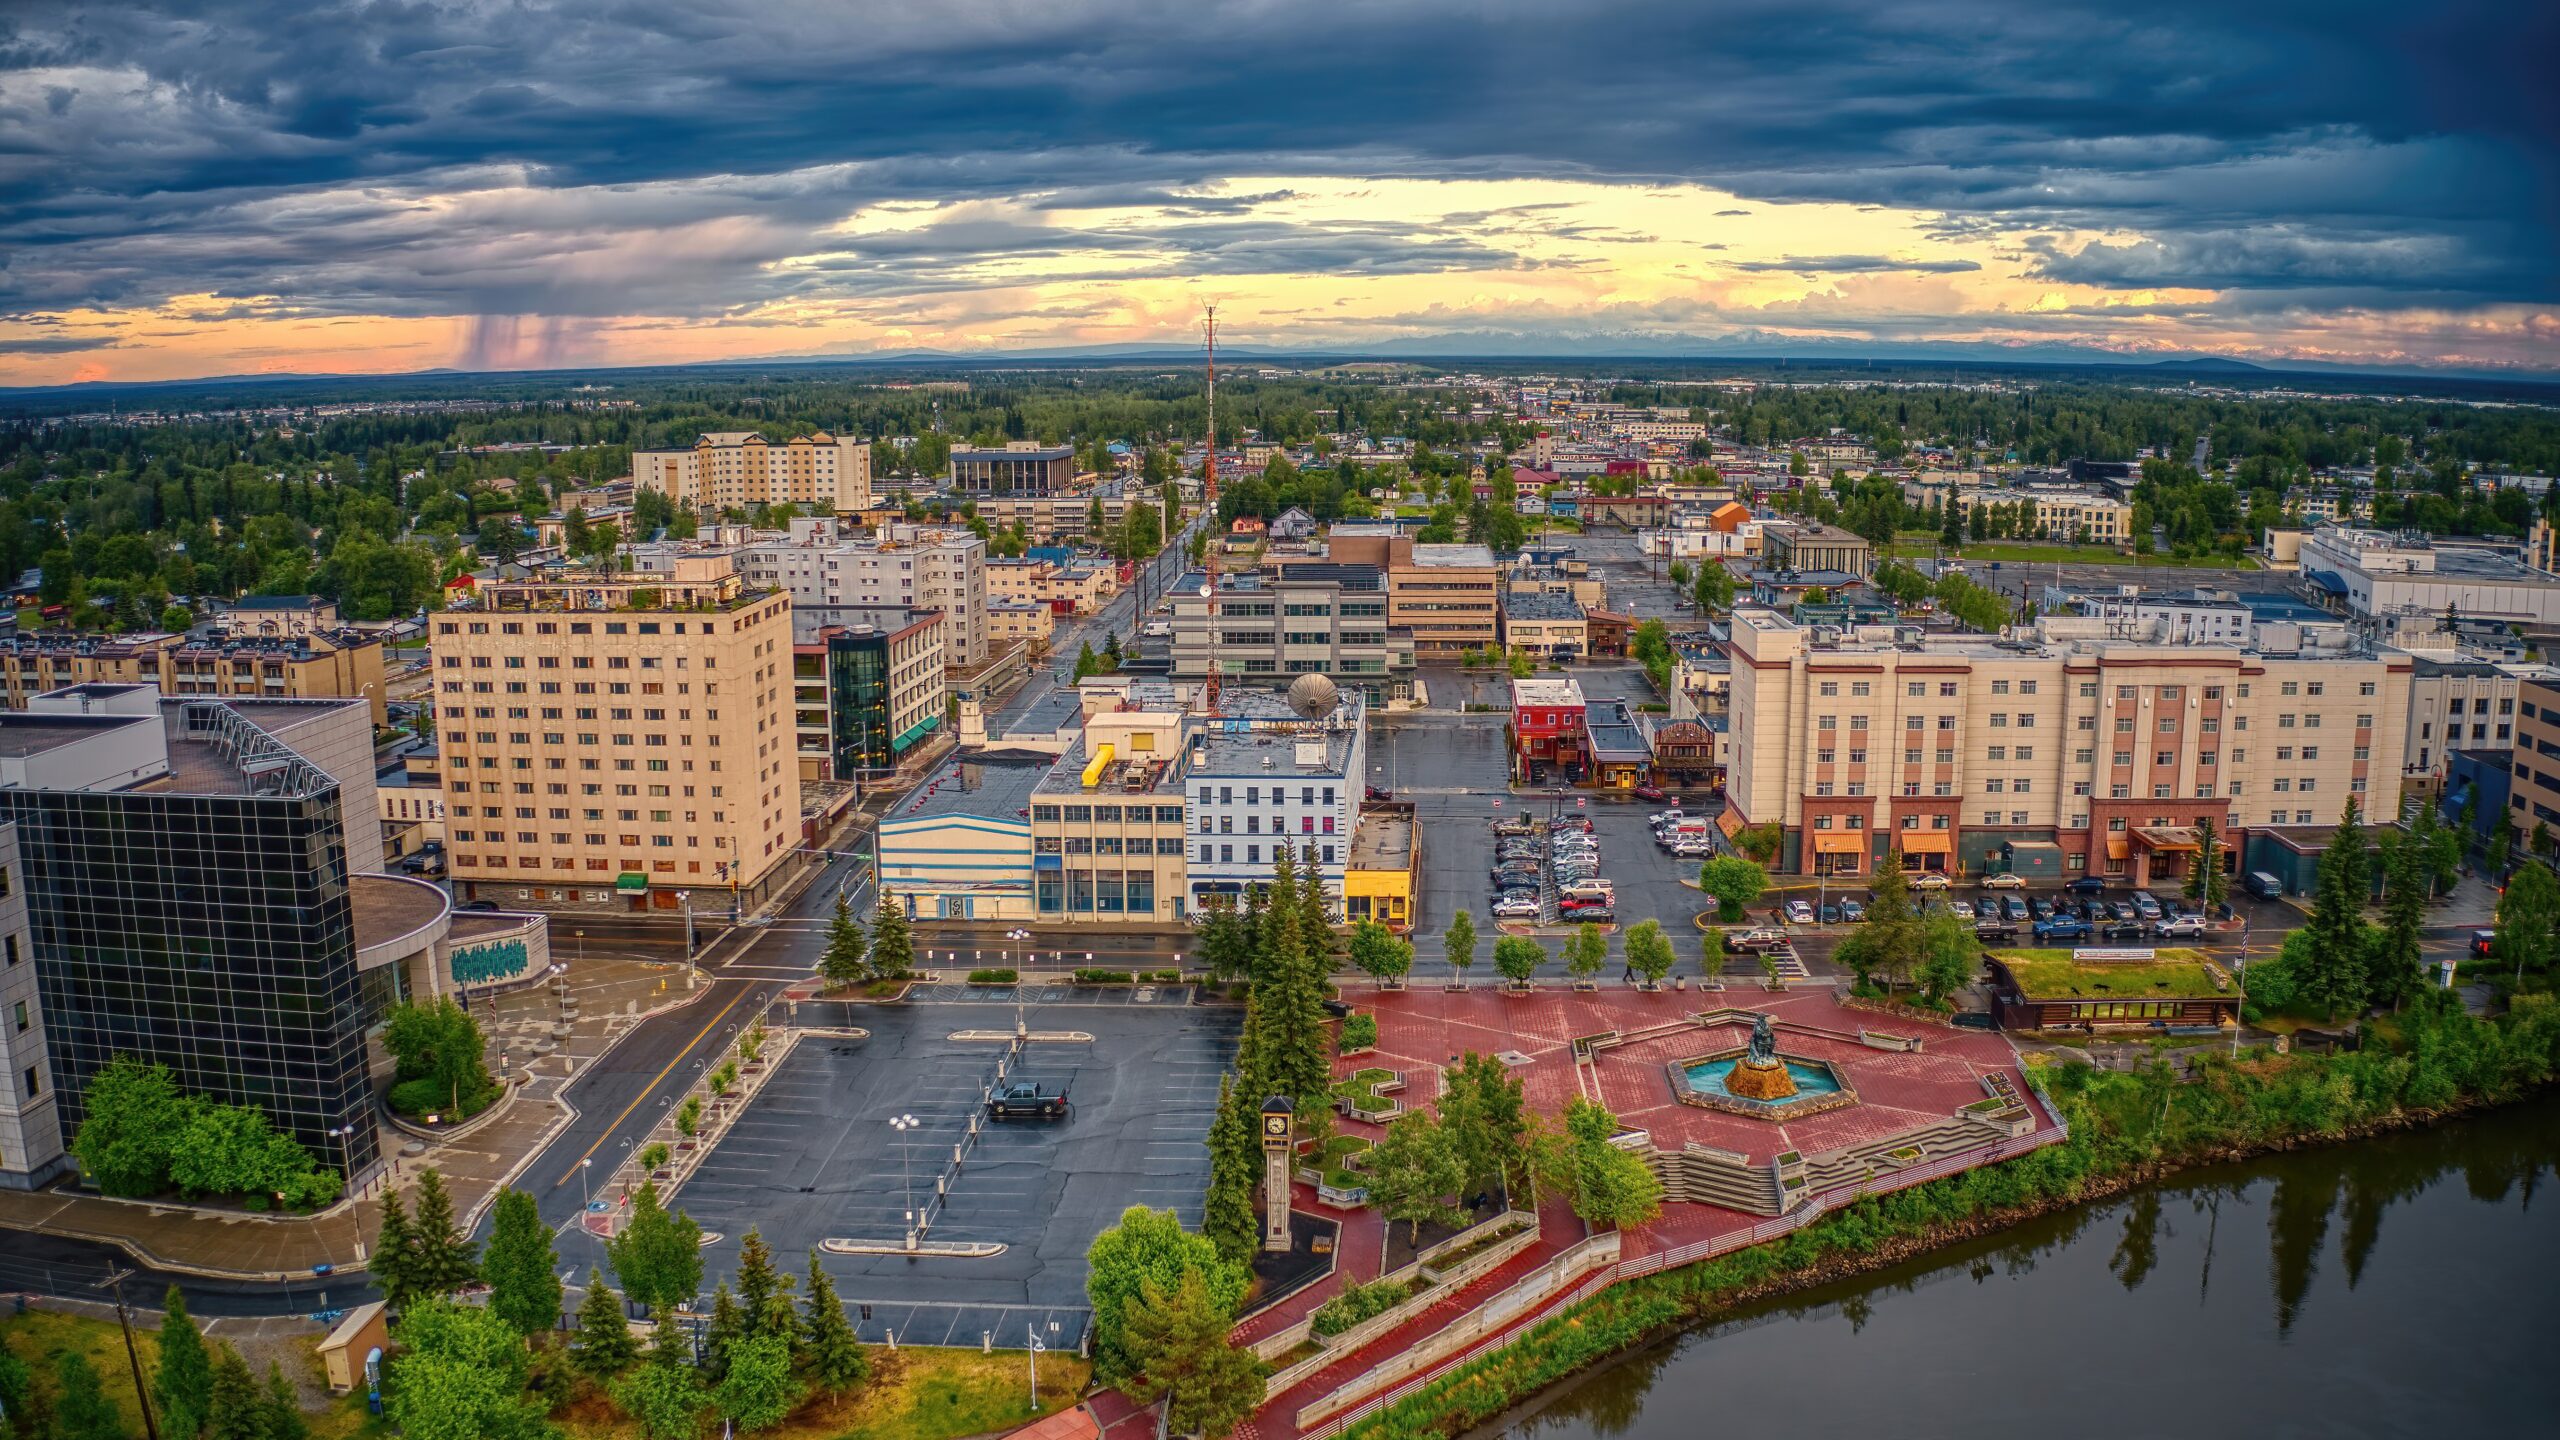
42. Alaska
Overall Score: 33.4
Working capital is hard to come by in the Last Frontier, which has both low approval rates (36th) and average loan amounts (40th) for 7(a) loans.
43. Delaware
Overall Score: 30.3
Many LLCs may formally call Delaware their home state, but they aren’t purchasing assets there. The Constitution State got only a trickle of 504 dollars (49th), for which it was hard to get approval (47th).
44. Louisiana
Overall Score: 26.2
Pelican State small businesses may face an uphill battle in getting funding. Approvals for both 7(a) (49th) and 504 (46th) loans were low in Louisiana, with very limited microloan access (41st, tied).
45. New Mexico
Overall Score: 24.9
New Mexico landed below the median in each of our metrics, with the brightest spot being 504 approvals (28th).
46. Mississippi
Overall Score: 23.5
504 lending in Mississippi is a winner-take-all affair, with those who are approved (50th) enjoying high borrowing amounts on average (5th).
47. Kentucky
Overall Score: 22.9
Strong microlending access (10th) wasn’t enough to pull Kentucky out of the bottom 10, which finished in the bottom half of all our other metrics.
48. Arkansas
Overall Score: 20.4
Arkansas wasn’t able to capture its fair share of 7(a) (35th) or 504 (40th) dollars, and relatively few small businesses received them (45th) and (43rd), respectively.
49. Hawaii
Overall Score: 17.2
Small businesses in the Aloha State saw decent average 504 loan sizes (25th), but working capital was elusive in 2022.
50. West Virginia
Overall Score: 13.8
Capital for small businesses is in short supply in West Virginia, which placed below 40th in all but two of our metrics.
COMPLETE RANKING OF ALL 50 STATES
For a complete look at how all 50 states performed in our ranking, check out the table below.
Methodology
To create our rankings, we selected seven metrics to understand each state’s recession performance. Within each metric, the lowest scoring state was given a rank of 0, while the highest ranking was given a rank of 100. Each metric was multiplied by a selected weight, then added together to create an overall score for each state.
Here are the seven metrics we chose, along with the percentage used to calculate the weight of each metric:
- SBA 7(a) Loan Approvals Per 100,000 Residents (25%): This metric measures how many SBA 7(a) loan approvals were made in 2022 within a state, controlling for that state’s population. The SBA 7(a) loan provides working capital to small businesses and is the most popular of the SBA’s loan guarantee programs. Data is sourced from the SBA and Census.gov
- SBA 7(a) Average Loan Size (15%): This metric represents the average size of SBA 7(a) loans disbursed to small businesses within the state. Data is sourced from the SBA and Census.gov
- SBA 7(a) % Of Dollars (15%): This metric represents the percentage of total dollars awarded nationally through the 7(a) program and reflects how effective the state is at leveraging SBA resources. Data is sourced from the SBA.
- SBA 504 Loan Approvals Per 100,000 Residents (20%): Whereas the SBA 7(a) program represents disbursements of working capital, the SBA 504 program is designed primarily to facilitate the purchase of hard assets like real estate and heavy equipment. This metric represents how effectively small businesses within the state were able to acquire capital to purchase hard assets, controlling for population. Data is sourced from the SBA and Census.govData is sourced from the SBA and Census.gov
- SBA 504 Average Loan Size (10%): This metric represents the average size of a loan that the state’s businesses received through the SBA 504 program. Data is sourced from the SBA and Census.gov.
- SBA 504 % Of Dollars (10%): This metric represents the percentage of total dollars awarded nationally through the 504 program and reflects how effective the state is at leveraging SBA resources. Data is sourced from the SBA.
- Microloan Intermediaries (5%): This metric represents the number of SBA microloan intermediaries that serve the state. SBA microloans are small-value loans designed to help underserved entrepreneurs (women, low-income, minority, veteran) access capital. Data is sourced from the SBA.
Data for this report was pulled from the Small Business Administration and Census.gov