

Table of contents
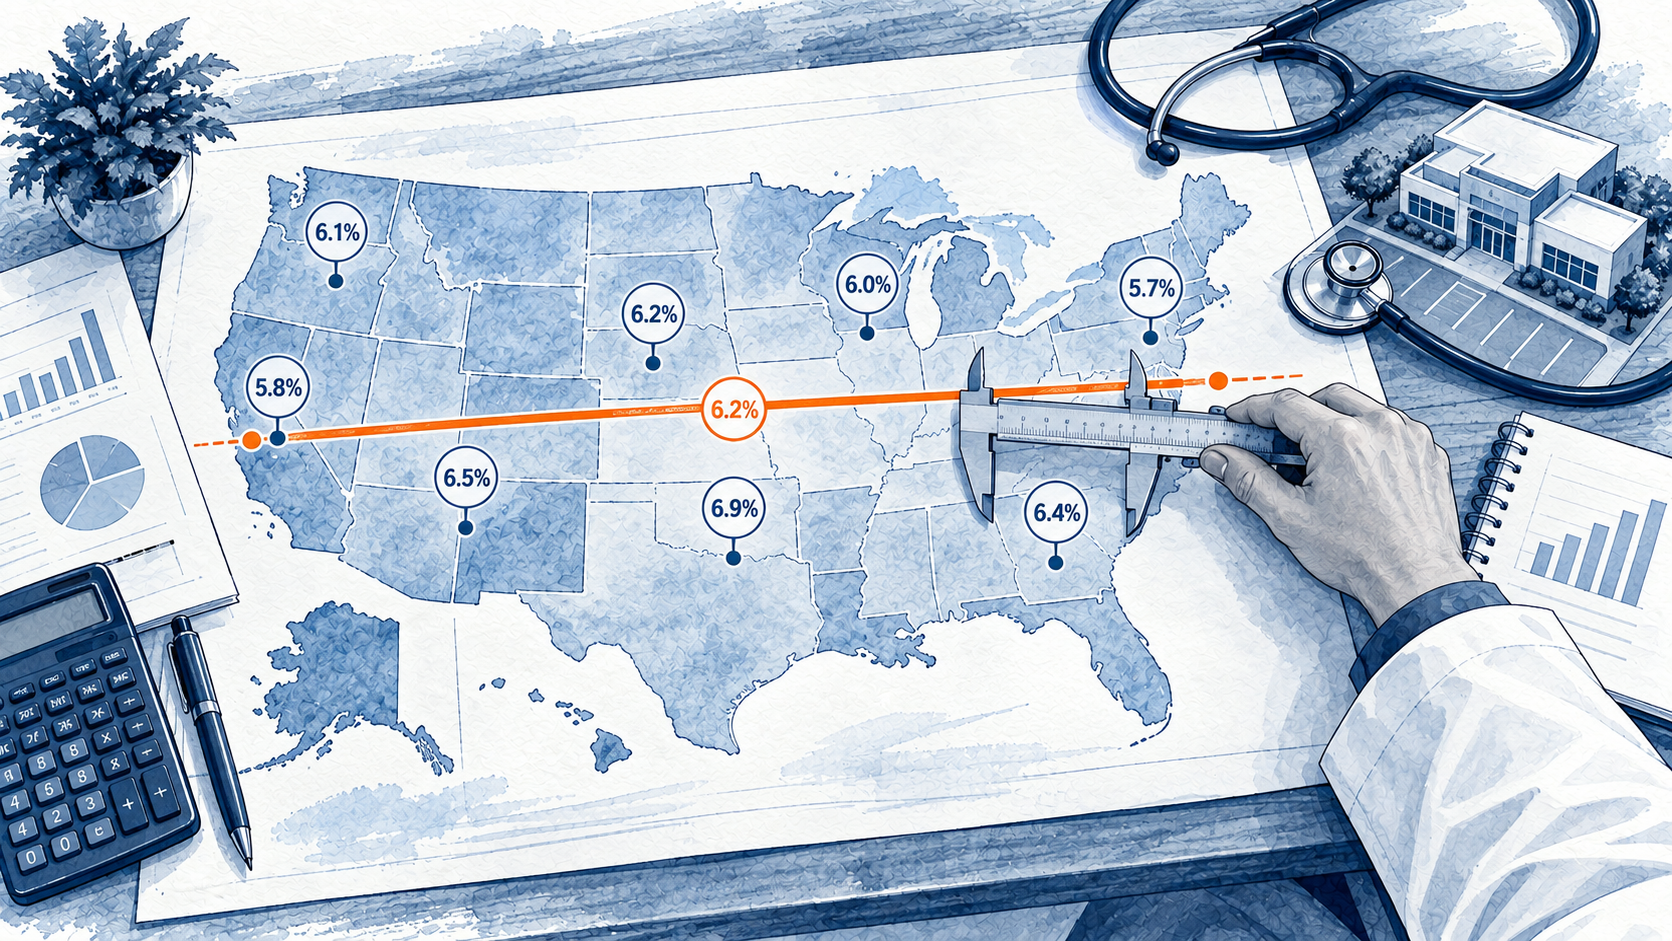
Medical equipment financing rates range from 5% to 30%+ APR in 2026, with credit score and lender type as the two most significant variables in determining where a healthcare business lands within that range.
We compiled this report from data published by the Equipment Leasing and Finance Association (ELFA) and the U.S. Bureau of Economic Analysis, as well as published lender rate disclosures current through June 2026. The benchmarks below give healthcare business owners a clear baseline for evaluating their options before committing to a capital structure.
Key takeaways:
- Medical equipment financing rates fall between 5% and 30%+ APR in 2026, depending on credit score and lender type
- At 84%, medical equipment claims the highest financing penetration rate of any equipment vertical in the U.S.
- U.S. medical equipment investment reached $125 billion in 2024; the ELFA Horizon Report puts 58% of total national equipment investment as financed
- 94% of healthcare administrators expect to reduce purchases or delay equipment upgrades due to tariff-related cost pressure, per the ELFA Foundation Vertical Market Outlook: Healthcare
- The global market is projected to grow from $214.97 billion in 2026 to $404.87 billion by 2035
Medical Equipment Financing Rates by Credit Tier: 2026
Credit score sets the foundation for every medical equipment financing offer. Lenders assign borrowers to risk tiers based on FICO scores, and each tier carries a different rate band and maximum term length. The table below reflects current benchmarks published by equipment financing lenders across multiple credit profiles.
Estimated APR range on a 0–30% scale. FICO range and typical term shown per tier.
| Credit Tier | FICO Range | Estimated APR Range | Typical Loan Term |
|---|---|---|---|
| Excellent | 750+ | 5% – 8% | 3–7 years |
| Good | 700–749 | 7% – 10% | 2–7 years |
| Fair | 650–699 | 9% – 12% | 2–5 years |
| Below Standard | 580–649 | 15% – 30% | 1–3 years |
| Subprime | Below 580 | 25%+ | 1–2 years |
APR ranges are drawn from published 2026 lender rate disclosures, not primary ELFA or government data. Sources include The Credit People, Bay Street Lending, and Crestmont Capital. Individual rates vary by lender and repayment term. Most conventional equipment lenders require a minimum FICO score of 650.
Key insights:
- A borrower in the excellent tier qualifies for rates more than twice as favorable as those of a below-standard borrower. On a $500,000 equipment purchase over 5 years, that difference can represent tens of thousands of dollars in total interest cost.
- Most conventional equipment lenders set their floor at 650 FICO. Borrowers below that threshold can still access financing through alternative lenders, though shorter terms and significantly higher rates come with that path.
Medical Equipment Financing Rate Ranges by Equipment Type: 2026
Rate expectations shift based on the specific asset being financed. Lenders factor in resale value and secondary-market strength for every equipment rate. Equipment with a strong secondary market consistently qualifies for lower rates than faster-depreciating devices. Our data below reflects current estimated APR ranges across major medical equipment categories for borrowers with good credit (700+ FICO).
Typical cost range on a $0–$3M scale. APR range and common term shown per type.
| Equipment Type | Typical Cost Range | Estimated APR Range | Common Term |
|---|---|---|---|
| MRI Machines | $225,000 – $3M+ | 5% – 10% | 5–7 years |
| CT Scanners | $250,000 – $2.5M | 5% – 10% | 5–7 years |
| Surgical Robots | $1M – $2.5M | 5% – 9% | 5–7 years |
| Diagnostic Imaging Equipment | $50,000 – $500,000 | 5% – 12% | 3–7 years |
| Dental and Specialty Equipment | $90,000 – $250,000 | 5% – 12% | 3–5 years |
| Patient Monitoring Systems | $10,000 – $100,000 | 6% – 14% | 2–5 years |
APR ranges are drawn from published 2026 lender rate disclosures. Cost ranges sourced from National Business Capital and IRAEmpire industry guides. Individual rates vary by lender.
Key insights:
- High-value diagnostic equipment such as MRI machines and CT scanners qualifies for the lowest rate bands because lenders treat these assets as strong, high-demand collateral with an established secondary market.
- Smaller monitoring and specialty devices depreciate faster, increasing lender risk and pushing rates toward the higher end of the medical equipment APR spectrum.
U.S. Medical Equipment Financing Market Overview: 2024 to 2026
Medical equipment consistently ranks as the most financed equipment vertical in the U.S. The table below compiles key market benchmarks from ELFA and the U.S. Bureau of Economic Analysis, supplemented by Precedence Research and Fortune Business Insights market data. Data reflects the most recent available reporting per source; vintages range from 2023 to 2026.
| Metric | Value | Source | Period |
|---|---|---|---|
| Global medical equipment financing market | $214.97 billion | Precedence Research | 2026 |
| North America market size | $85.57 billion | Fortune Business Insights | 2026 |
| U.S. medical equipment investment | $125 billion | U.S. Bureau of Economic Analysis | 2024 |
| Medical equipment share of ELFA member volume | 4.4% | ELFA Survey of Equipment Finance Activity | 2024 |
| Percentage of medical equipment acquisitions financed | 84% | ELFA / Equipment Leasing & Finance Foundation | 2023 |
| Total U.S. equipment finance market | $1.34 trillion | ELFA Horizon Report | 2023 |
| Medical equipment investment change (March 2026) | -0.8% YoY | ELFA Investment Momentum Monitor | Q1 2026 |
Key insights:
- Medical equipment's 84% financing penetration rate outpaces every other equipment vertical in the U.S., reflecting both the high cost of acquisition and consistent lender confidence in the asset class.
- The -0.8% year-over-year decline in investment in March 2026 reflects near-term caution among healthcare companies, but ELFA projects investment growth to resume through Q3 2026 as cost pressures ease.
Equipment Loan vs. Lease Rate and Structure Comparison: 2026
The choice between an equipment loan and a lease shapes both the rate and the total cost of capital over the financing term. Healthcare businesses planning to use equipment beyond its financing period tend to favor loans for ownership benefits. Practices in fast-evolving specialties may prioritize leases for upgrade flexibility. The table below compares the two structures across the variables that most directly affect total financing costs.
| Factor | Equipment Loan | Equipment Lease (FMV) |
|---|---|---|
| Typical APR Range | 5% – 15% | 6% – 14% |
| Ownership at Term End | Borrower owns asset | Lender retains ownership |
| Down Payment Required | 10%–20% (0% available with select lenders) | Often none required |
| Tax Treatment | Section 179 deduction eligible | Full payments deductible as operating expense |
| Upgrade Flexibility | Fixed asset | Return or upgrade at term end |
| Minimum Credit Score | 650+ FICO (most lenders) | 600+ FICO |
| Typical Term Length | 2–7 years | 2–5 years |
Key insights:
- Equipment loans deliver stronger long-term economics for practices planning to use the same equipment past the loan term. Section 179 deductions can offset a meaningful portion of the total cost when the borrower owns the asset outright.
- Fair market value leases carry marginally higher APR ranges than loans but require less upfront capital, making them a practical choice for practices managing tight operating cash flow or expecting frequent technology upgrades.
Healthcare businesses evaluating a significant equipment purchase benefit from advisor input before committing to a financing structure. Talk to an advisor at National Business Capital to compare options and understand which structure best fits the business's current needs and the equipment's intended use.
Further Reading
National Business Capital has published additional resources for healthcare business owners evaluating equipment financing options:
- Can I Get a Loan to Purchase Medical Equipment?
- Medical Practice Loans: Everything You Need to Know
- Medical Equipment Financing: How It Works
- Equipment Financing: Solutions and What to Know
To request a PDF copy of this report, contact our research team directly.
Sources
- ELFA: Equipment Finance in the Medical Equipment Industry
- Equipment Leasing & Finance Foundation Horizon Report
- Equipment Leasing & Finance Foundation: Vertical Market Outlook, Healthcare
- Precedence Research: Medical Equipment Financing Market
- Fortune Business Insights: Medical Equipment Financing Market
- U.S. Bureau of Economic Analysis
- The Credit People: What Are Current Equipment Financing Rates?
- Bay Street Lending: Equipment Financing Guide 2026
- Crestmont Capital: Equipment Financing with Bad Credit
- IRAEmpire: Medical Equipment Financing Guide 2026
ABOUT THE AUTHOR

As COO, Phil oversees National Business Capital’s funding operations, tech infrastructure, and data intelligence. He breaks down the funding trends that matter most to decision-makers, with a special focus on leadership and CFOs who want to understand where capital is flowing and why it matters.